이 글의 원문은 https://opencv-python-tutroals.readthedocs.io/en/latest/py_tutorials/py_imgproc/py_thresholding/py_thresholding.html#thresholding 입니다.
이미지에 대한 Thresholding 연산을 수행할 때, 임계치 값을 개발자가 직접 지정해 주었는데 이를 자동으로 계산하기 위한 방법이 있습니다. 바로 Otsu의 이진화(Binarization)입니다. Otsu의 이진화(Binarization)가 가장 효과적으로 발휘될 수 있는 이미지는 Historam의 피크(Peak)가 2개 인 경우입니다. 피크가 2개가 아닌 경우 결과는 부정확할 수 있습니다. 이미지의 히스토그램에서 피크를 2개 갖도록 블러링을 통해 잡음을 제거하기도 합니다. 아래의 예제를 살펴보겠습니다.
import cv2
import numpy as np
from matplotlib import pyplot as plt

img = cv2.imread('./data/apple.jpg', 0)

# 임계치를 127로 지정한 경우
ret1,th1 = cv2.threshold(img, 127, 255, cv2.THRESH_BINARY)

# Otsu 방법으로 임계치를 내부적으로 계산하여 지정한 경우
ret2,th2 = cv2.threshold(img, 0, 255, cv2.THRESH_BINARY+cv2.THRESH_OTSU)

# 잡음 감소를 위해 Gaussian filtering 연산 후 Otsu 방법으로 임계치를 계산한 경우
blur = cv2.GaussianBlur(img, (5,5), 0)
ret3,th3 = cv2.threshold(blur, 0, 255, cv2.THRESH_BINARY+cv2.THRESH_OTSU)

print(ret1, ret2, ret3)

# plot all the images and their histograms
images = [img, 0, th1,
          img, 0, th2,
          blur, 0, th3]

titles = ['Original Noisy Image','Histogram','Global Thresholding (v=127)',
          'Original Noisy Image','Histogram',"Otsu's Thresholding",
          'Gaussian filtered Image','Histogram',"Otsu's Thresholding"]

for i in range(3):
    plt.subplot(3,3,i*3+1),plt.imshow(images[i*3],'gray')
    plt.title(titles[i*3]), plt.xticks([]), plt.yticks([])
    plt.subplot(3,3,i*3+2),plt.hist(images[i*3].ravel(),256)
    plt.title(titles[i*3+1]), plt.xticks([]), plt.yticks([])
    plt.subplot(3,3,i*3+3),plt.imshow(images[i*3+2],'gray')
    plt.title(titles[i*3+2]), plt.xticks([]), plt.yticks([])

plt.show()
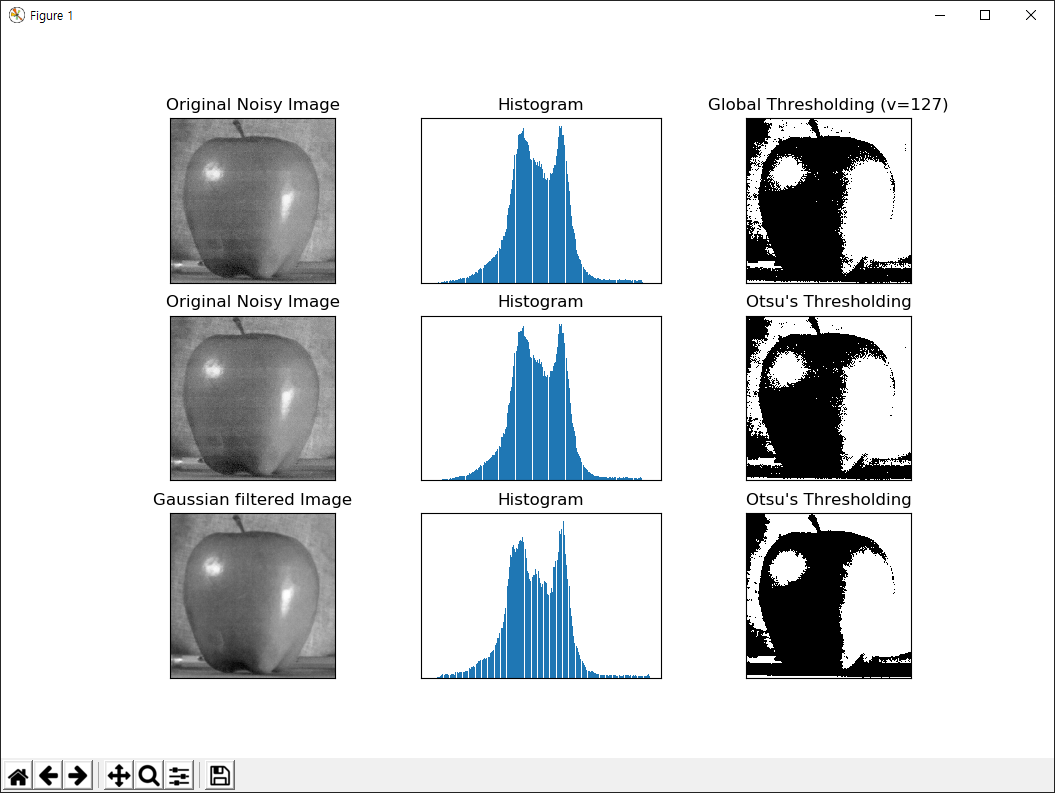
결과는 아래와 같습니다.

동일한 이미지에 대해 3번의 Thresholding 연산을 수행한 결과입니다. 8번 코드는 임계치를 127로 명시하여 Thresholding 연산을 수행한 것이고 11번 코드는 임계치를 미지정(0)하고 4번째에 cv2.THRESH_OTSU 옵션을 지정하여 임계치를 자동으로 계산하도록 하였습니다. 이 경우 v2.threshold 함수는 ret2 변수에 계산된 임계치 값이 반환됩니다. 15번 코드는 이미지를 먼저 가우시안 블러링 처리를 수행하고 Othu 방식의 Thresholding을 수행합니다. 이미지에 잡음이 많은 경우 이 방식을 통해 Peak가 2개인 히스토그램을 생성합니다. 이미 원본 이미지의 히스토그램이 Peak를 2개 가지고 있으므로 3개의 결과가 큰 차이가 없지만 잡음이 매우 심한 이미지의 경우 가우시안 블러링 처리를 수행 후 Othu 방식의 Thresholding 연산은 큰 의미가 있습니다.
