함수들에 대한 그래프 시각화

선형 함수에 대한 정의와 그래프 시각화는 다음 코드와 같다.

import numpy as np
import matplotlib.pylab as plt

def identity_func(x):
    return x

x = np.arange(-10, 10, 0.01)
plt.plot(x, identity_func(x), linestyle='-', label="identity")
plt.ylim(-10, 10)
plt.legend()
plt.show() 

결과는 다음과 같다.
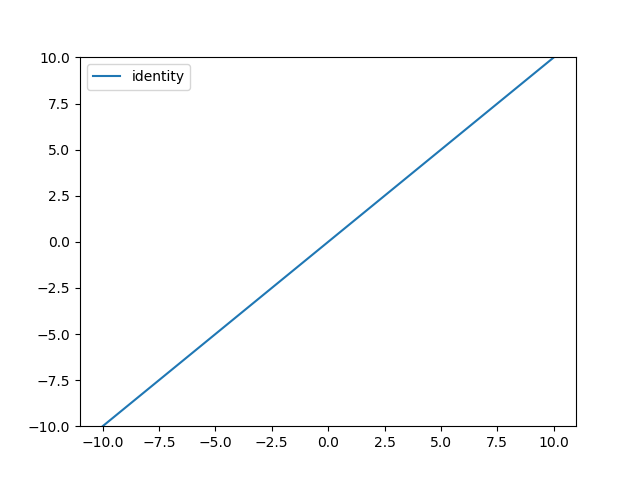
기울기와 y절편을 고려한 선형 함수의 정의는 다음과 같다.

import numpy as np
import matplotlib.pylab as plt
  
def linear_func(x):
    return 2 * x + 1 
 
x = np.arange(-10, 10, 0.01)
plt.plot(x, linear_func(x), linestyle='-', label="linear_func")
plt.ylim(-10, 10)
plt.legend()
plt.show() 

결과는 다음과 같다.
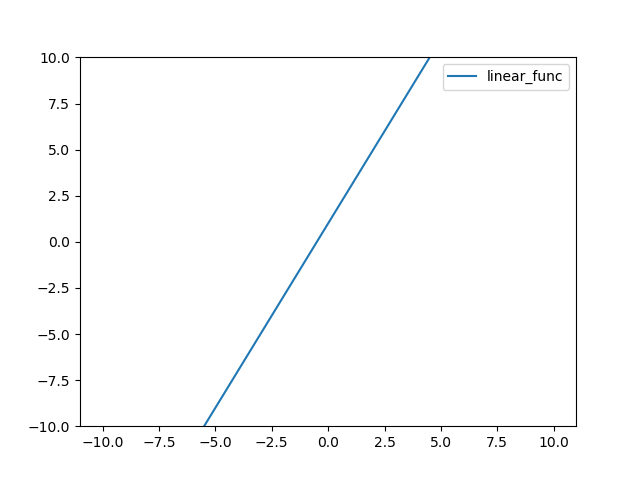
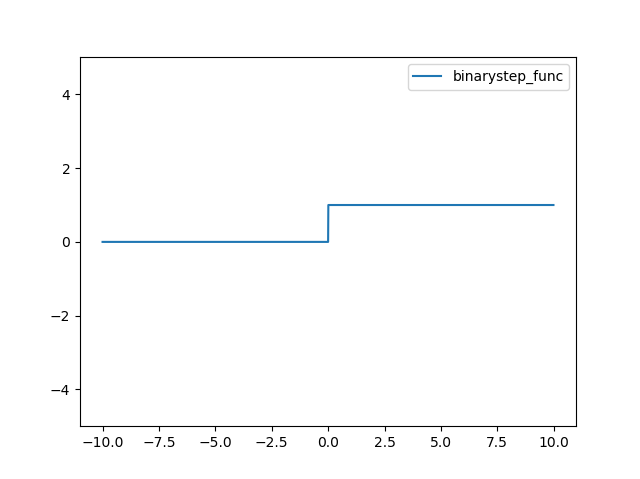
계단함수에 대한 정의는 다음과 같다.

import numpy as np
import matplotlib.pylab as plt
 
def binarystep_func(x):
    return (x>=0)*1
 
x = np.arange(-10, 10, 0.01)
plt.plot(x, binarystep_func(x), linestyle='-', label="binarystep_func")
plt.ylim(-5, 5)
plt.legend()
plt.show() 

결과는 다음과 같다.
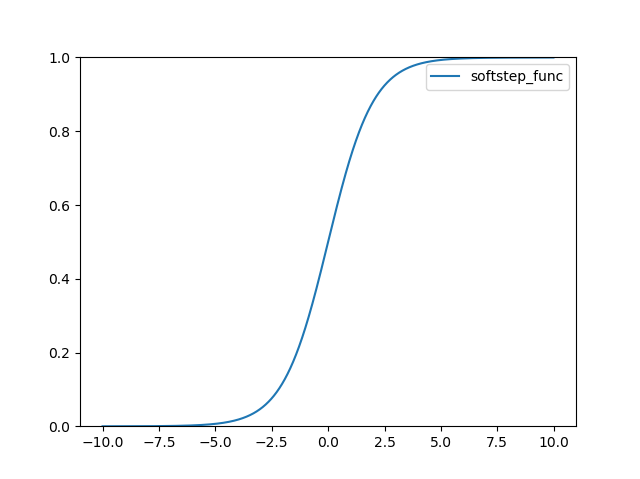
로지스틱(Logistic) 또는 시그모이드(Sigmoid)라고 불리는 함수 정의는 다음과 같다.

import numpy as np
import matplotlib.pylab as plt

def softstep_func(x):
    return 1 / (1 + np.exp(-x))

x = np.arange(-10, 10, 0.01)
plt.plot(x, softstep_func(x), linestyle='-', label="softstep_func")
plt.ylim(0, 1)
plt.legend()
plt.show()     

결과는 다음과 같다.
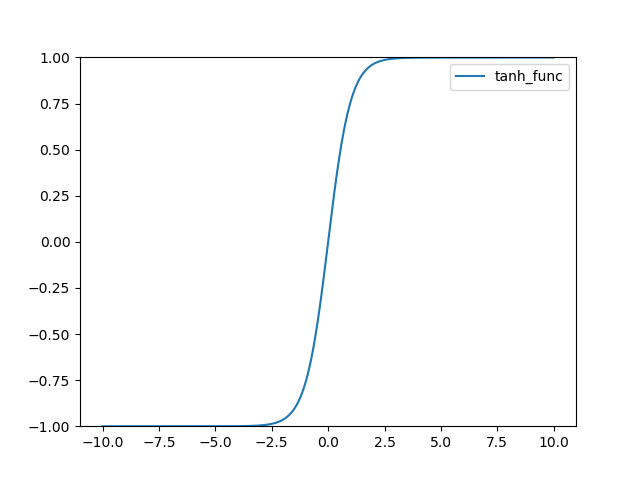
TanH 함수 정의 다음과 같다.

import numpy as np
import matplotlib.pylab as plt
 
def tanh_func(x):
    return np.tanh(x)
 
x = np.arange(-10, 10, 0.01)
plt.plot(x, tanh_func(x), linestyle='-', label="tanh_func")
plt.ylim(-1, 1)
plt.legend()
plt.show()     

그래프는 다음과 같다.
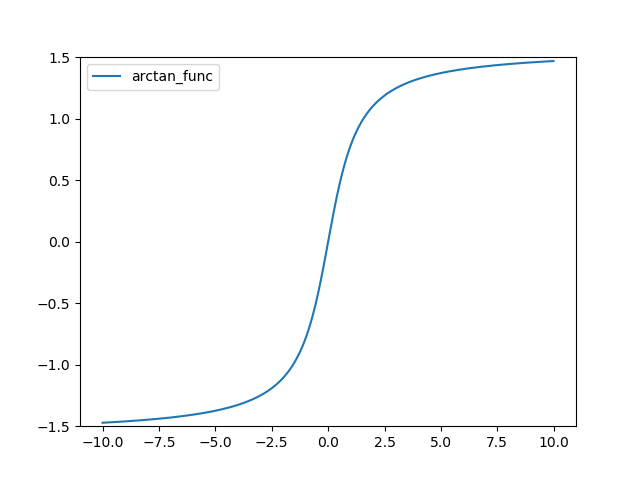
ArcTan 함수 정의는 다음과 같다.

import numpy as np
import matplotlib.pylab as plt

def arctan_func(x):
    return np.arctan(x)
 
x = np.arange(-10, 10, 0.01)
plt.plot(x, arctan_func(x), linestyle='-', label="arctan_func")
plt.ylim(-1.5, 1.5)
plt.legend()
plt.show()     

그래프는 다음과 같다.
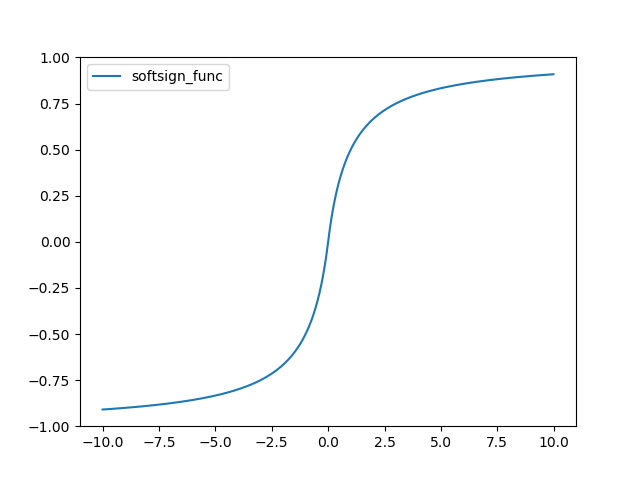
Soft Sign 함수는 다음과 같다.

import numpy as np
import matplotlib.pylab as plt
 
def softsign_func(x):
    return x / ( 1+ np.abs(x) )
 
x = np.arange(-10, 10, 0.01)
plt.plot(x, softsign_func(x), linestyle='-', label="softsign_func")
plt.ylim(-1, 1)
plt.legend()
plt.show()     

그래프는 다음과 같다.
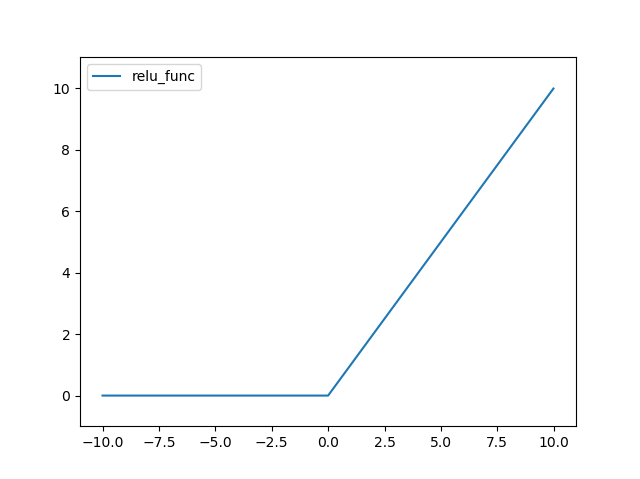
ReLU(Rectified Linear Unit) 함수는 다음과 같다.

import numpy as np
import matplotlib.pylab as plt
 
def relu_func(x):
    return (x>0)*x
 
x = np.arange(-10, 10, 0.01)
plt.plot(x, relu_func(x), linestyle='-', label="relu_func")
plt.ylim(-1, 11)
plt.legend()
plt.show()     

결과는 다음과 같다.
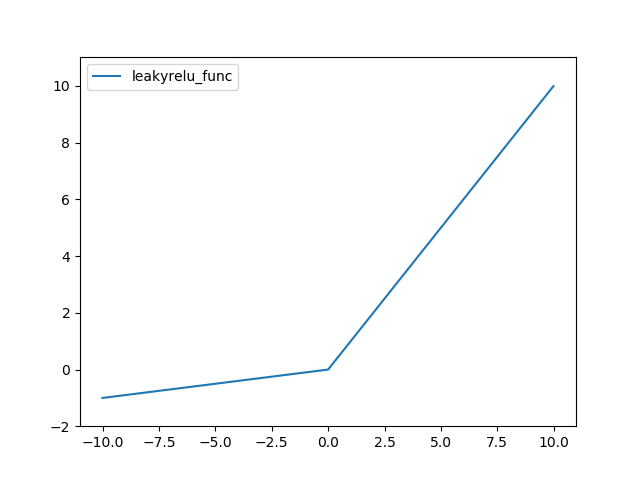
Leaky ReLU 함수는 다음과 같다.

import numpy as np
import matplotlib.pylab as plt
 
def leakyrelu_func(x, alpha=0.1):
    return (x>=0)*x + (x<0)*alpha*x
 
x = np.arange(-10, 10, 0.01)
plt.plot(x, leakyrelu_func(x), linestyle='-', label="leakyrelu_func")
plt.ylim(-2, 11)
plt.legend()
plt.show()   

결과는 다음과 같다.
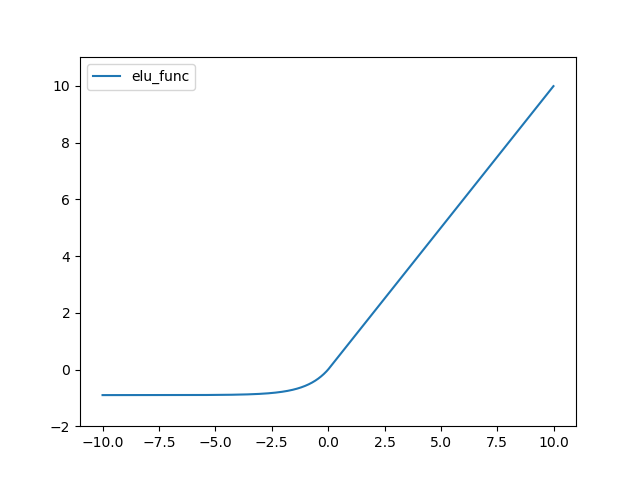
ELU(Exponential Linear Unit) 함수는 다음과 같다.

def elu_func(x, alpha=0.9):
    return (x>=0)*x + (x<0)*alpha*(np.exp(x)-1)
 
x = np.arange(-10, 10, 0.01)
plt.plot(x, elu_func(x), linestyle='-', label="elu_func")
plt.ylim(-2, 11)
plt.legend()
plt.show()    

결과는 다음과 같다.
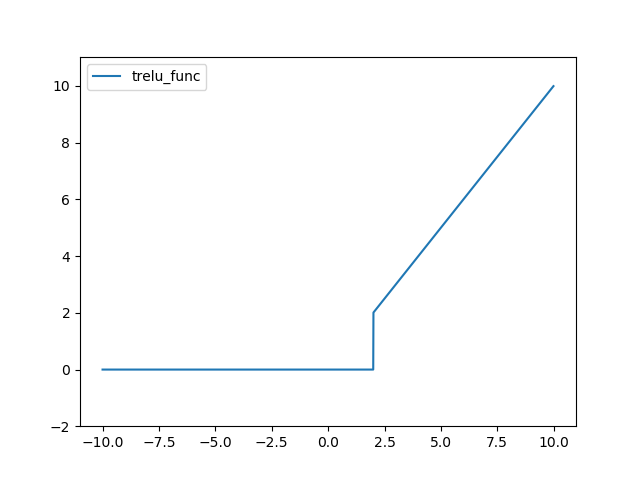
TreLU 함수는 다음과 같다.

import numpy as np
import matplotlib.pylab as plt
 
def trelu_func(x, thres=2):
    return (x>thres)*x
 
x = np.arange(-10, 10, 0.01)
plt.plot(x, trelu_func(x), linestyle='-', label="trelu_func")
plt.ylim(-2, 11)
plt.legend()
plt.show()     

결과는 다음과 같다.
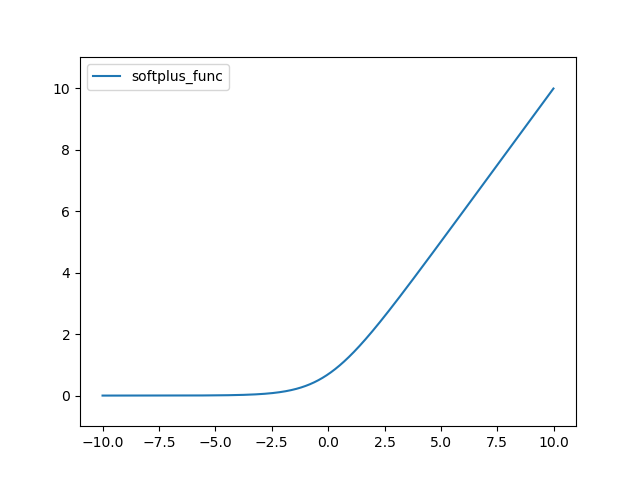
SoftPlus 함수는 다음과 같다.

import numpy as np
import matplotlib.pylab as plt
 
def softplus_func(x):
    return np.log( 1 + np.exp(x) )
 
x = np.arange(-10, 10, 0.01)
plt.plot(x, softplus_func(x), linestyle='-', label="softplus_func")
plt.ylim(-1, 11)
plt.legend()
plt.show()     

결과는 다음과 같다.
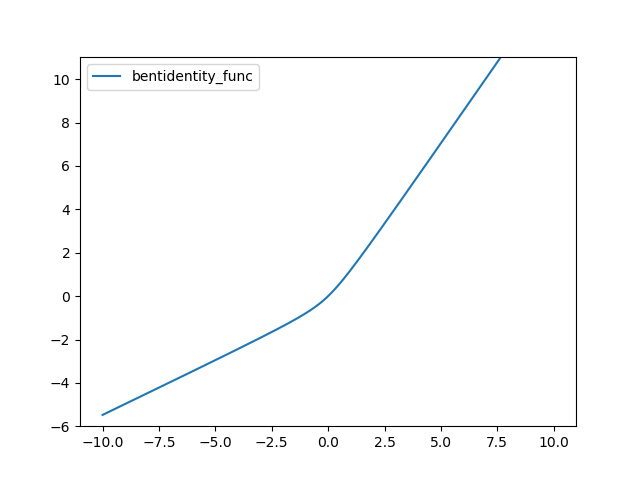
Bent identity 함수는 다음과 같다.

import numpy as np
import matplotlib.pylab as plt
 
def bentidentity_func(x):
    return (np.sqrt(x*x+1)-1)/2+x

x = np.arange(-10, 10, 0.01)
plt.plot(x, bentidentity_func(x), linestyle='-', label="bentidentity_func")
plt.ylim(-6, 11)
plt.legend()
plt.show()

결과는 다음과 같다.
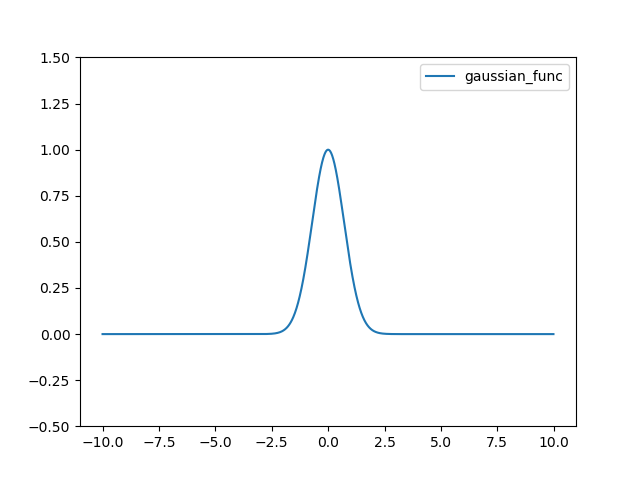
Gaussian 함수는 다음과 같다.

import numpy as np
import matplotlib.pylab as plt
 
def gaussian_func(x):
    return np.exp(-x*x)
 
x = np.arange(-10, 10, 0.01)
plt.plot(x, gaussian_func(x), linestyle='-', label="gaussian_func")
plt.ylim(-0.5, 1.5)
plt.legend()
plt.show()

결과는 다음과 같다.
psql을 설치된 서버에서 직접 실행하기

PostgreSQL에 대한 콘솔 관리자는 psql입니다. 현재 CentOS에서 설치해 사용중이고, DB 작업시에는 Telnet을 통해 작업을 해왔는데, 시간을 단축하고자 원격방식이 아닌 직접 서버단에서 작업을 했습니다. 원격 작업시 준비된 SQL에 대한 처리에만 2일정도 소요되는 작업이 10시간정도 소요되었습니다.

이 글은 추후 PostgreSQL이 설치된 서버에서 직접 psql을 실행하고자 할때 입력했던 콘솔 명령을 기록해 둡니다.

먼저 아래처럼 root로 로그인한 상태에서 postgres 계정으로 전환합니다.

sudo -i -u postgres

그리고 psql을 실행합니다. 바로 암호를 묻는데 postgres 계정에 대한 암호를 입력합니다.

기본적으로 psql은 postgres라는 이름의 데이터베이스에 연결됩니다. 이를 내가 원하는 데이터베이스로 연결하고자할 때 아래처럼 입력합니다.

\c database_name_to_be_connected

필요하다면, SQL 문의 인코딩 방식을 변경해줘야 하는데요. 아래처럼 입력하여 원하는 방식으로 변경할 수 있습니다.

set client_encoding = 'UTF8';

이제 준비된 SQL문이 저장된 파일로부터 SQL 문을 실행하기 위해 아래처럼 입력합니다.

\i /somewhere_dir/file_name_to_be_ran

pandas의 DataFrame에 대한 Inner Join, Outer Join, Left Join, Right Join

판다스에서 데이터프레임은 테이블 형식의 데이터셋입니다. DBMS의 Table들 간에도 Join을 맺을 수 있듯이, 마찬가지로 판다스의 데이터프레임들 간에도 Join을 맺을 수 있습니다. 물론 Join을 맺을 공통 필드가 존재한다면 말입니다.

Join에는 모두 4가지 방식이 존재합니다. 즉, 두 데이터셋 간의 중복된 요소만을 Join하는 Inner Join과 두 데이터셋에 대한 모든 데이터를 Join하는 Outter Join, 그리고 왼쪽 데이터셋을 기준으로 하는 Left Join과 오른쪽 데이터셋을 기준으로 하는 Right Join입니다. 보다 명확한 Join의 파악은 아래의 코드 예제를 통해 파악할 수 있습니다.

먼저 Join 하고자 하는 데이터셋으로, 판다스의 데이터프레임을 아래 코드처럼 정의합니다.

import pandas as pd

data_A = {'key': [1,2,3], 'name': ['Jane', 'John', 'Peter']}
dataframe_A = pd.DataFrame(data_A, columns = ['key', 'name'])

data_B = {'key': [2,3,4], 'age': [18, 15, 20]}
dataframe_B = pd.DataFrame(data_B, columns = ['key', 'age'])

print(dataframe_A)
print(dataframe_B)

결과는 아래와 같습니다.

   key   name
0    1   Jane
1    2   John
2    3  Peter
   key  age
0    2   18
1    3   15
2    4   20

두 데이터프레임 간에는 key라는 공통 필드가 존재하는 것을 볼 수 있습니다. 이를 토대로 먼저 Inner Join에 대한 코드입니다.

df_INNER_JOIN = pd.merge(dataframe_A, dataframe_B, left_on='key', right_on='key', how='inner')
print(df_INNER_JOIN)

위의 코드의 결과는 다음과 같습니다.

   key   name  age
0    2   John   18
1    3  Peter   15

다음은 Outer Join에 대한 코드입니다.

df_OUTER_JOIN = pd.merge(dataframe_A, dataframe_B, left_on='key', right_on='key', how='outer')
print(df_OUTER_JOIN)

결과는 다음과 같습니다.

   key   name   age
0    1   Jane   NaN
1    2   John  18.0
2    3  Peter  15.0
3    4    NaN  20.0

다음은 Left Join에 대한 코드입니다.

df_LEFT_JOIN = pd.merge(dataframe_A, dataframe_B, left_on='key', right_on='key', how='left')
print(df_LEFT_JOIN)

결과는 다음과 같습니다.

   key   name   age
0    1   Jane   NaN
1    2   John  18.0
2    3  Peter  15.0

다음은 Right Join에 대한 코드입니다.

df_RIGHT_JOIN = pd.merge(dataframe_A, dataframe_B, left_on='key', right_on='key', how='right')
print(df_RIGHT_JOIN)

다음은 실행 결과입니다.

   key   name  age
0    2   John   18
1    3  Peter   15
2    4    NaN   20

모든 Join은 pd.merge 함수를 통해 이루어지는데요. 위의 예제 코드를 보면 두 데이터프레임의 Join 필드가 모두 ‘key’라는 것을 알 수 있습니다. 이처럼 Join 필드의 이름이 동일할 경우 pd.merge의 left_on과 right_on 인자 대신 on 인자 하나로 대체가 가능합니다. 예를들어, Inner Join의 경우는 아래와 같습니다.

df_INNER_JOIN = pd.merge(dataframe_A, dataframe_B, on='key')

pd.merge 함수의 인자중 how도 생략되었는데, 이는 Inner Join이 pd.merge의 인자 how의 기본값이기 때문입니다.

사람의 눈, 코, 귀 그리고 팔과 다리를 검출하는 Person Keypoints Detection

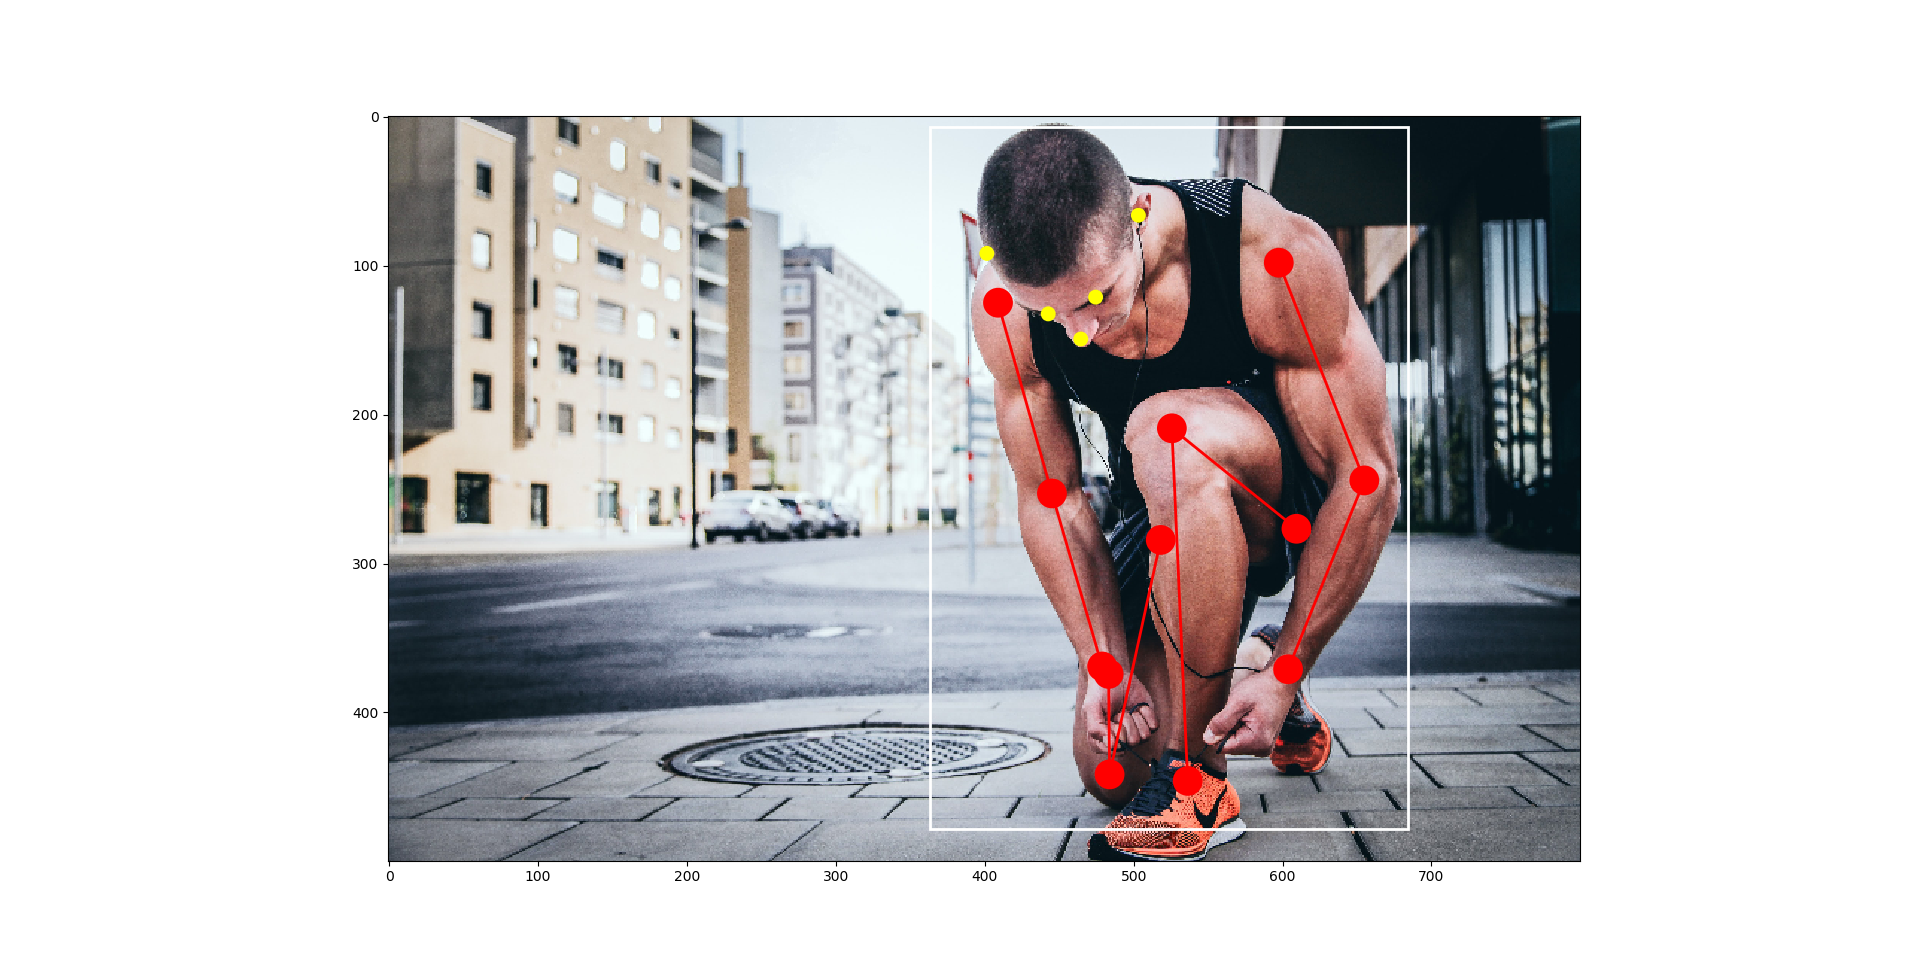
이미지에 대한 Detection의 한 종류로 Person Keypoints Detection이 있습니다. 이 Detection은 사람의 눈, 코, 귀 그리고 팔과 다리를 검출합니다. 아래처럼요.

머신러닝 라이브리 중에 하나인, PyTorch에서는 Person Keypoints Detection을 위한 모델에 대해서 이미 잘 학습된 데이터를 제공합니다. 이 글은 미리 학습된 데이터를 활용하여 이미지에서 사람의 눈, 코, 귀와 팔 그리고 다리를 검출하는 코드를 살펴봅니다.

아울러 이 글에서는 matplotlib에서 그래프나 이미지를 단순히 표시하는 것에서 원하는 도형을 원하는 위치에 표시하는 API도 파악할 수 있습니다.

먼저 필요한 패키지를 import 합니다.

import numpy as np
from PIL import Image

import torch
import torchvision
from torchvision import models
import torchvision.transforms as T

import matplotlib.pyplot as plt
from matplotlib.path import Path
import matplotlib.patches as patches

미리학습된 데이터를 활용하여 Person Keypoints Detection을 위한 모델을 가져오는데, 머신러닝은 대규모의 행렬연산에 최적화된 GPU에서 수행하는 것이 제맛이므로 GPU 연산을 통해 신경망 모델을 로드합니다.

device = torch.device("cuda" if torch.cuda.is_available() else "cpu") # CPU to GPU
model = models.detection.keypointrcnn_resnet50_fpn(pretrained=True).to(device).eval()

이미지를 불러오고 이미지의 크기를 줄입니다. GPU의 메모리가 충분하다면 이미지를 원본 크기 그대로 사용해도 되지만, 이미지를 가로로 800px로 줄여줍니다. 메모리를 덜 사용하는 것도 있고, 속도도 크게 향상되겠죠.

IMAGE_SIZE = 800
 
img = Image.open('data/running_1.jpg')
img = img.resize((IMAGE_SIZE, int(img.height * IMAGE_SIZE / img.width)))

검출을 수행합니다. 이를 위해 먼저 입력 이미지를 텐서로 변환해야합니다.

trf = T.Compose([
    T.ToTensor()
])

input_img = trf(img).to(device) # CPU to GPU

out = model([input_img])[0]

out 변수에 사람에 대한 눈, 코, 귀 그리고 팔과 다리에 대한 정보가 담겨 있습니다. 이 변수를 이용해 이미지 상에 해당 정보를 시각화 합니다.

codes = [
    Path.MOVETO,
    Path.LINETO,
    Path.LINETO
]

fig, ax = plt.subplots(1)
ax.imshow(img)

THRESHOLD = 0.9 # 해당 정보의 정확도가 90% 이상인 것만 사용

for box, score, keypoints in zip(out['boxes'], out['scores'], out['keypoints']):
    score = score.detach().cpu().numpy() # GPU to CPU

    if score < THRESHOLD:
        continue

    box = box.detach().cpu().numpy() # GPU to CPU
    keypoints = keypoints.detach().cpu().numpy()[:, :2] # GPU to CPU

    # 사람에 대한 영역을 그리기
    rect = patches.Rectangle((box[0], box[1]), box[2]-box[0], box[3]-box[1], linewidth=2, edgecolor='white', facecolor='none')
    ax.add_patch(rect)

    # 왼쪽 팔에 대한 선 그리기
    path = Path(keypoints[5:10:2], codes)
    line = patches.PathPatch(path, linewidth=2, facecolor='none', edgecolor='red')
    ax.add_patch(line)
    
    # 오른쪽 팔에 대한 선 그리기
    path = Path(keypoints[6:11:2], codes)
    line = patches.PathPatch(path, linewidth=2, facecolor='none', edgecolor='red')
    ax.add_patch(line)
    
    # 왼쪽 다리에 대한 선 그리기
    path = Path(keypoints[11:16:2], codes)
    line = patches.PathPatch(path, linewidth=2, facecolor='none', edgecolor='red')
    ax.add_patch(line)
    
    # 오른쪽 다리에 대한 선 그리기
    path = Path(keypoints[12:17:2], codes)
    line = patches.PathPatch(path, linewidth=2, facecolor='none', edgecolor='red')
    ax.add_patch(line)

    # 눈,코,귀는 노란색으로 그리고 팔다리의 시작점과 끝점은 빨간색으로 그리기
    for i, k in enumerate(keypoints):
        if i < 5:
            RADIUS = 5
            FACE_COLOR = 'yellow'
        else:
            RADIUS = 10
            FACE_COLOR = 'red'

        circle = patches.Circle((k[0], k[1]), radius=RADIUS, facecolor=FACE_COLOR)
        ax.add_patch(circle)    

plt.show()    

어제 휴일이라 일찍 잠들었더니, 새벽 3시에 일어났습니다. 글을 작성하던 중에 새벽 4시 조금 넘어서 마켓컬리 배송이 왔네요. 시간을 초월한 마켓컬리의 배송.. 고생이 많으십니당..