PyTorch의 Tensor 연산 퀵 레퍼런스

이 글은 PyTorch를 이용한 딥러닝 개발 시에 Tensor 연산에 대한 내용을 빠르게 참조하기 위해 정리한 글입니다.

#1. 난수값으로 구성된 2×3 텐서 생성

import torch

x = torch.rand(2,3)
print(x)

#2. 정규분포 난수값으로 구성된 2×3 텐서 생성

import torch

x = torch.randn(2,3)
print(x)

#3. [0,10) 까지의 정수형 난수값으로 구성된 2×3 텐서 생성

import torch

x = torch.randint(0,10,size=(2,3))
print(x)

#4. 0으로 채워진 2×3 텐서 생성

import torch

x = torch.zeros(2,3)
print(x)

#5. 다른 텐서의 형상과 동일한 Zero 텐서 생성하기

import torch

ref = torch.rand(2,3)
x = torch.zeros_like(ref)
print(x)

#6. 1로 채워진 2×3 텐서 생성하기

import torch

x = torch.ones(2,3)
print(x)

#7. 다른 텐서의 형상과 동일한 1값으로 구성된 텐서 생성하기

import torch

ref = torch.rand(2,3)
x = torch.ones_like(ref)
print(x)

#8. 텐서의 타입 얻기

import torch

x = torch.rand(2,3)
print(x.type()) # torch.FloatTensor
print(type(x)) # 

#9. 요소값을 정수형 값으로 변환한 텐서 생성하기

import torch

x = torch.rand(2,3) + 1.5
int_x = x.type(dtype=torch.IntTensor)
print(int_x)

#10. 넘파이 배열로부터 텐서 만들기, 텐서로부터 넘파이 배열 만들기

import torch
import numpy as np

x1 = np.ndarray(shape=(2,3), dtype=int, buffer=np.array([1,2,3,4,5,6]))
x2 = torch.from_numpy(x1)
print(x2, x2.type())

x3 = x2.numpy()
print(x3)

#11. 요소값 배열을 통해 실수형 텐서 만들기

import torch

x = torch.FloatTensor([[1,2,3],[4,5,6]])
print(x)

#12. 텐서를 GPU에, 또는 CPU로 옮기기

import torch

x = torch.FloatTensor([[1,2,3],[4,5,6]])

cpu = torch.device('cpu')
gpu = torch.device('cuda')

if torch.cuda.is_available():
    x_gpu = x.to(gpu)
    print(x_gpu)

x_cpu = x_gpu.to(cpu)
print(x_cpu)

#13. 텐서의 크기

import torch

x = torch.FloatTensor(2,3,4,4)
print(x.size()) # torch.Size([2, 3, 4, 4])
print(x.size()[1:2]) torch.Size([3])

#14. 텐서의 요소값 접근

import torch

x = torch.randn(4,3)
print(x)
''' output:
tensor([[ 0.1477,  0.4707, -0.7333],
        [ 0.8718,  0.1213,  0.6299],
        [ 0.2991,  1.1437, -0.7631],
        [ 1.3319,  0.8322, -2.4153]])
'''

print(x[1:3,:])
''' output:
tensor([[ 0.8718,  0.1213,  0.6299],
        [ 0.2991,  1.1437, -0.7631]])
'''

#15. 인덱스값으로 지정된 요소값으로 구성된 새로운 텐서 생성하기(값 복사됨)

import torch

x = torch.randn(4,3)
print(x)
'''output:
tensor([[-0.1728,  0.0887, -0.0186],
        [ 0.9492, -0.0452,  0.5660],
        [-0.4184, -0.2162,  1.0297],
        [-0.5110,  0.2452,  1.0734]])
'''

selected = torch.index_select(x,dim=1,index=torch.LongTensor([0,2]))
print(selected)
'''output:
tensor([[-0.1728, -0.0186],
        [ 0.9492,  0.5660],
        [-0.4184,  1.0297],
        [-0.5110,  1.0734]])
'''

#16. 마스크 텐서로 새로운 텐서 생성하기

import torch

x = torch.randn(2,3)
print(x)
'''output:
tensor([[ 0.1622,  1.1205, -0.4761],
        [ 0.9225,  0.2151,  0.2192]])
'''

mask = torch.BoolTensor([[False, False, True],[False,True,False]])
out = torch.masked_select(x, mask)
print(out)
'''output:
tensor([-0.4761,  0.2151])
'''

#17. 2개의 텐서 결합하기

import torch

x = torch.FloatTensor([[1,2,3],[4,5,6]])
y = torch.FloatTensor([[-1,-2,-3],[-4,-5,-6]])

z1 = torch.cat([x,y], dim=0)
print(z1)
'''
tensor([[ 1.,  2.,  3.],
        [ 4.,  5.,  6.],
        [-1., -2., -3.],
        [-4., -5., -6.]])
'''

z2 = torch.cat([x,y], dim=1)
print(z2)
'''
tensor([[ 1.,  2.,  3., -1., -2., -3.],
        [ 4.,  5.,  6., -4., -5., -6.]])
'''

#18. 2개의 텐서 결합하기(stack 함수)

import torch

x = torch.FloatTensor([[1,2,3],[4,5,6]])
x_stack = torch.stack([x,x,x,x],dim=0)
print(x_stack)
'''
tensor([[[1., 2., 3.],
         [4., 5., 6.]],

        [[1., 2., 3.],
         [4., 5., 6.]],

        [[1., 2., 3.],
         [4., 5., 6.]],

        [[1., 2., 3.],
         [4., 5., 6.]]])
'''

y_stack = torch.stack([x,x,x,x],dim=1)
print(y_stack)
'''
tensor([[[1., 2., 3.],
         [1., 2., 3.],
         [1., 2., 3.],
         [1., 2., 3.]],

        [[4., 5., 6.],
         [4., 5., 6.],
         [4., 5., 6.],
         [4., 5., 6.]]])
'''

#19. 하나의 텐서를 n개로 분해하기

import torch

z1 = torch.FloatTensor([
    [ 1.,  2.,  3.],
    [ 4.,  5.,  6.],
    [-1., -2., -3.],
    [-4., -5., -6.]
])
x_1,x_2 = torch.chunk(z1,2,dim=0)
print(x_1,x_2,sep='\n')
'''
tensor([[1., 2., 3.],
        [4., 5., 6.]])
tensor([[-1., -2., -3.],
        [-4., -5., -6.]])
'''

y_1,y_2 = torch.chunk(z1,2,dim=1)
print(y_1,y_2,sep='\n')
'''
tensor([[ 1.,  2.],
        [ 4.,  5.],
        [-1., -2.],
        [-4., -5.]])
tensor([[ 3.],
        [ 6.],
        [-3.],
        [-6.]])
'''

#20. 하나의 텐서를 분리하기

import torch

z1 = torch.FloatTensor([
    [ 1.,  2.,  3.],
    [ 4.,  5.,  6.],
    [-1., -2., -3.],
    [-4., -5., -6.]
])
x1,x2 = torch.split(z1,2,dim=0)
print(x1,x2,sep='\n')
'''
tensor([[1., 2., 3.],
        [4., 5., 6.]])
tensor([[-1., -2., -3.],
        [-4., -5., -6.]])
'''

y1,y2 = torch.split(z1,2,dim=1)
print(y1,y2,sep='\n')
'''
tensor([[ 1.,  2.],
        [ 4.,  5.],
        [-1., -2.],
        [-4., -5.]])
tensor([[ 3.],
        [ 6.],
        [-3.],
        [-6.]])
'''

y = torch.split(z1,2,dim=1)
for i in y:
    print(i)
'''
tensor([[ 1.,  2.],
        [ 4.,  5.],
        [-1., -2.],
        [-4., -5.]])
tensor([[ 3.],
        [ 6.],
        [-3.],
        [-6.]])
'''

#21. 1개 요소를 갖는 축 제거

import torch

x1 = torch.FloatTensor(10,1,3,1,4)
x2 = torch.squeeze(x1)
print(x1.size(),x2.size()) # torch.Size([10, 1, 3, 1, 4]) torch.Size([10, 3, 4])

#22. unsqueeze 연산

import torch

x1 = torch.FloatTensor(10,3,4)
x2 = torch.unsqueeze(x1, dim=0)
print(x1.size(),x2.size()) # torch.Size([10, 3, 4]) torch.Size([1, 10, 3, 4])

x3 = torch.unsqueeze(x1, dim=1)
print(x1.size(),x3.size()) # torch.Size([10, 3, 4]) torch.Size([10, 1, 3, 4])

#23. 다양한 분포를 갖는 텐서 만들기

import torch
import torch.nn.init as init

x1 = init.uniform_(torch.FloatTensor(3,4),a=0,b=9)
print(x1)

x2 = init.normal_(torch.FloatTensor(3,4),std=0.2)
print(x2)

x3 = init.constant_(torch.FloatTensor(3,4),3.1415926)
print(x3)

#24. 텐서간의 합

import torch

x1 = torch.FloatTensor([[1,2,3],[4,5,6]])
x2 = torch.FloatTensor([[1,2,3],[4,5,6]])

add1 = torch.add(x1,x2)
print(add1)

add2 = x1+x2
print(add2)

#25. 텐서의 브로드케스트 합

import torch

x1 = torch.FloatTensor([[1,2,3],[4,5,6]])
x2 = x1 + 10
print(x2)

#26. 텐서 요소간의 곱

import torch

x1 = torch.FloatTensor([[1,2,3],[4,5,6]])
x2 = torch.FloatTensor([[1,2,3],[4,5,6]])

x3 = torch.mul(x1,x2)
print(x3)
'''
tensor([[ 1.,  4.,  9.],
        [16., 25., 36.]])
'''

x4 = x1*x2
print(x4)
'''
tensor([[ 1.,  4.,  9.],
        [16., 25., 36.]])
'''

#27. 텐서 요소간의 나누기

import torch

x1 = torch.FloatTensor([[1,2,3],[4,5,6]])
x2 = torch.FloatTensor([[1,2,3],[4,5,6]])

x3 = torch.div(x1,x2)
print(x3)
'''
tensor([[1., 1., 1.],
        [1., 1., 1.]])
'''

x4 = x1/x2
print(x4)
'''
tensor([[1., 1., 1.],
        [1., 1., 1.]])
'''

#28. 텐서 요소의 제곱

import torch

x1 = torch.FloatTensor([[1,2,3],[4,5,6]])

x2 = torch.pow(x1,2)
print(x2)
'''
tensor([[ 1.,  4.,  9.],
        [16., 25., 36.]])
'''

x3 = x1**2
print(x3)
'''
tensor([[ 1.,  4.,  9.],
        [16., 25., 36.]])
'''

#29. 텐서 요소의 지수 연산

import torch

x1 = torch.FloatTensor([[1,2,3],[4,5,6]])
x2 = torch.exp(x1)
print(x2)

#30. 텐서 요소의 로그 연산

import torch

x1 = torch.FloatTensor([[1,2,3],[4,5,6]])
x2 = torch.log(x1)
print(x2)

#31. 행렬곱

import torch

x1 = torch.FloatTensor([[1,2,3],[4,5,6]])
x2 = torch.FloatTensor([[1,2,3],[4,5,6],[7,8,9]])
x3 = torch.mm(x1,x2)
print(x3)
'''
tensor([[30., 36., 42.],
        [66., 81., 96.]])
'''

#32. 배치 행렬곱 연산(맨 앞에 batch 차원은 유지하면서 뒤에 요소들의 행렬곱)

import torch

x1 = torch.FloatTensor([
    [[1,2,3],[4,5,6]],
    [[1,2,3],[4,5,6]],
])
x2 = torch.FloatTensor([
    [[1,2,3],[4,5,6],[7,8,9]],
    [[1,2,3],[4,5,6],[7,8,9]],
])
x3 = torch.bmm(x1,x2)
print(x3)
'''
tensor([[[30., 36., 42.],
         [66., 81., 96.]],

        [[30., 36., 42.],
         [66., 81., 96.]]])
'''

#33. 벡터의 내적

import torch

x1 = torch.tensor([1,2,3,4])
x2 = torch.tensor([2,3,4,5])
x3 = torch.dot(x1,x2)
print(x3) # tensor(40)

#34. 텐서의 전치

import torch

x1 = torch.tensor([[1,2,3],[4,5,6],[7,8,9]])
print(x1)
x2 = x1.t()
print(x2)

#35. 텐서의 내부 차원 간 바꿈

import torch

hwc_img_data = torch.rand(100, 64, 32, 3)
print(hwc_img_data.size()) # torch.Size([100, 64, 32, 3])
chw_img_data = hwc_img_data.transpose(1,2)
print(chw_img_data.size()) # torch.Size([100, 32, 64, 3])
chw_img_data = chw_img_data.transpose(1,3)
print(chw_img_data.size()) # torch.Size([100, 3, 64, 32])

#36. 벡터의 내적, 행렬과 벡터의 곱, 행렬간 곱

import torch

m = torch.randn(100,10)
v = torch.randn(10)

d = torch.matmul(v,v) # = torch.dot, 벡터의 내적
print(d)

v2 = torch.matmul(m,v) # = torch.mv, 행렬과 벡터의 곱
print(v2)

m2 = torch.matmul(m.t(), m) # = torch.mm, 행렬 곱
print(m2)

#37. 다항분포 확률값 기반의 샘플링

import torch
 
x1 = torch.FloatTensor(
    [
        [1,2,3,4,5,6,7,8,9],
        [9,8,7,6,5,4,3,2,1],
        [1,2,3,4,5,6,7,8,9],
        [9,8,7,6,5,4,3,2,1]
    ]
)
i = torch.multinomial(x1.exp(), 1)
print(i)
'''
output:
tensor([[8],
        [0],
        [7],
        [1]])
'''

torch.multinomial 함수는 2개의 인자를 받는데, 첫번째 인자는 확률로 해석될 수 있는 텐서이고 두번째는 샘플링할 개수이다. 첫번째 인자는 확률로 해석할 수 있지만, 정규화될 필요는 없다. 여기서 정규화란 더해서 1이 되어야 한다는 의미이다. 결과에서 보면 알 수 있듯이 샘플링된 값의 인덱스 값이 반환된다.

#38. 상위 n개 가져오기

import torch
 
x = torch.rand(10)
print(x) # tensor([0.9097, 0.3766, 0.6321, 0.0760, 0.0137, 0.1760, 0.0655, 0.7696, 0.5172, 0.4140])

scores, indices = torch.topk(x, 3)

for i in range(0,3):
    print(indices[i].item(), scores[i].item())
'''output:
0 0.909696102142334
7 0.769554853439331
2 0.6320836544036865
'''

[PyQt5] QPainter를 이용한 다양한 그래픽

위젯은 자신을 다시 그릴때 paintEvent 함수를 호출합니다. 즉, 위젯에 무언가를 그리기에 가장 적당한 시점은 paintEvent입니다. 또한 여기에 그래픽 요소를 그리기 위해서 QPainter라는 API를 사용할 수 있습니다. 이 두가지를 조합하여 위젯을 상속받는 윈도우를 화면에 표시하고 이 윈도우에 원하는 그래픽 요소를 그리는 예를 살펴보겠습니다.

먼저 위젯을 상속받는 MyWindow라는 클래스를 하나 정의하는데, 이 클래스에는 앞서 언급한 paintEvent 함수를 재정의하고 있습니다.

import sys, random
from PyQt5.QtWidgets import QWidget, QApplication
from PyQt5.QtGui import QPainter, QColor, QFont, QPen, QBrush, QPainterPath
from PyQt5.QtCore import Qt

class MyWindow(QWidget):
    def __init__(self):
        super().__init__()
        self.initUI()
        
    def initUI(self):      
        self.setGeometry(300, 300, 400, 400)
        self.setWindowTitle('QPainter를 이용한 그래픽스')
        self.show()

    def paintEvent(self, event):
        qp = QPainter()
        qp.begin(self)

        # 그리기 함수의 호출 부분

        qp.end()
        
if __name__ == '__main__':
    app = QApplication(sys.argv)
    ex = MyWindow()
    sys.exit(app.exec_())

위의 코드에서 20번째 줄에 그리기 함수를 호출함으로써 그 결과를 살펴볼 수 있는데요. 그리기 함수는 MyWindow 클래스의 맴버 함수로써 정의합니다. 먼저 텍스트를 그리는 함수입니다.

    def drawText(self, event, qp):
        qp.setPen(QColor(0, 0, 0))
        qp.setFont(QFont('나눔명조', 35))
        qp.drawText(event.rect(), Qt.AlignCenter, '스산한 늦가을\n아니.. 초겨울인가?')

결과는 아래와 같습니다.

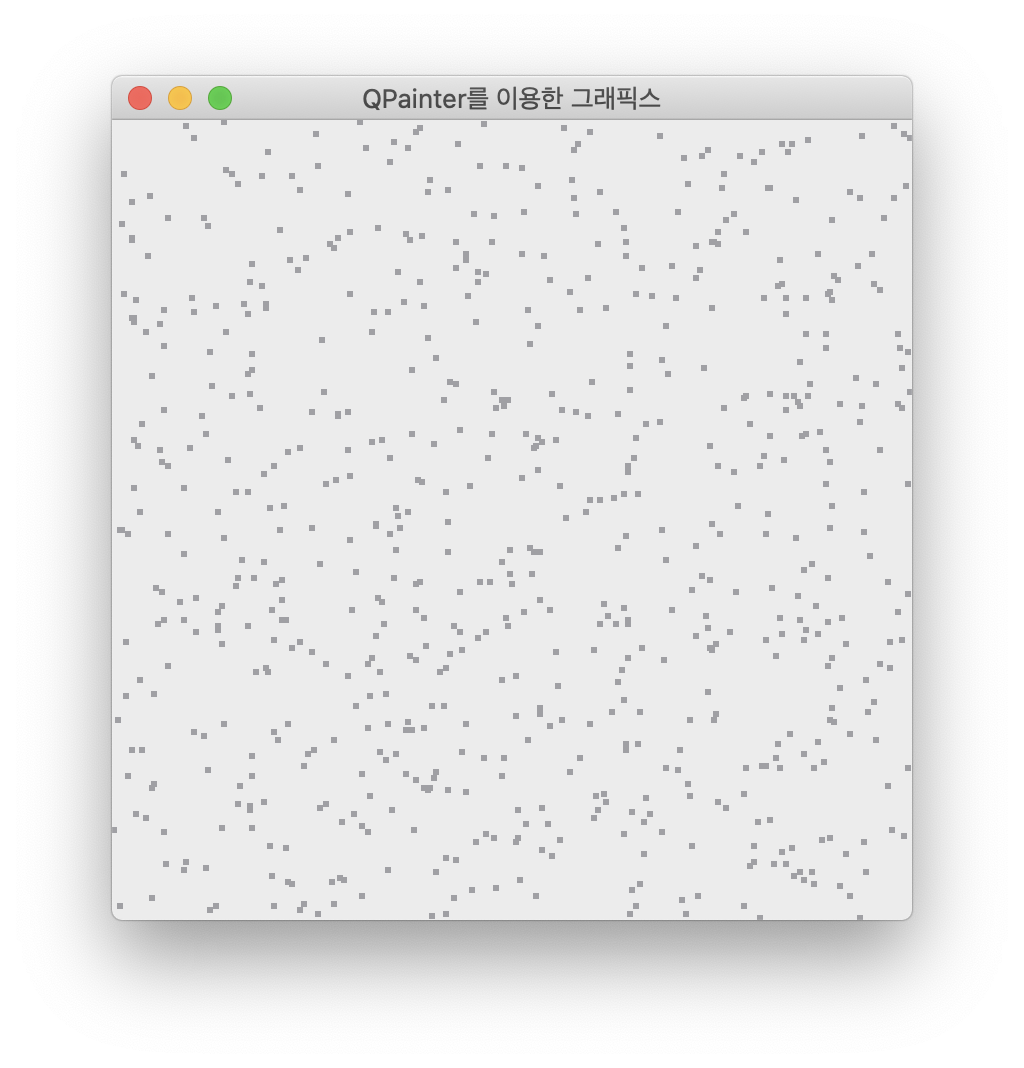
다음은 화면에 포인트를 찍는 함수입니다.

    def drawPoints(self, event, qp):
        pen = QPen(Qt.gray, 3)
        qp.setPen(pen)

        size = self.size()
        
        for i in range(700):
            x = random.randint(1, size.width()-1)
            y = random.randint(1, size.height()-1)
            qp.drawPoint(x, y)  

결과는 아래와 같습니다.

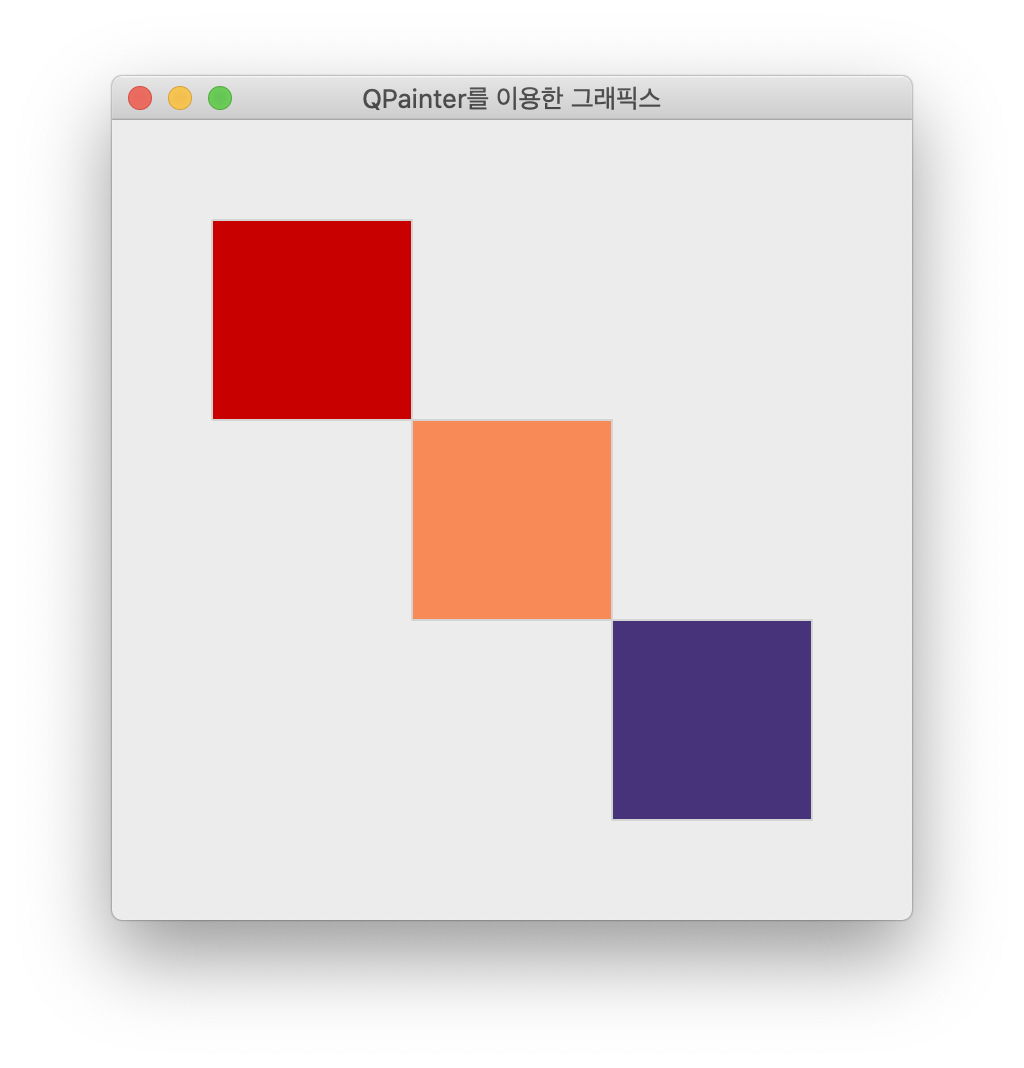
다음은 사각형을 그리는 함수입니다.

    def drawRectangles(self, qp):
        col = QColor(0, 0, 0)
        col.setNamedColor('#d4d4d4')
        qp.setPen(col)

        qp.setBrush(QColor(200, 0, 0))
        qp.drawRect(50, 50, 100, 100)

        qp.setBrush(QColor(255, 80, 0, 160))
        qp.drawRect(150, 150, 100, 100)

        qp.setBrush(QColor(25, 0, 90, 200))
        qp.drawRect(250, 250, 100, 100)

결과는 아래와 같습니다.

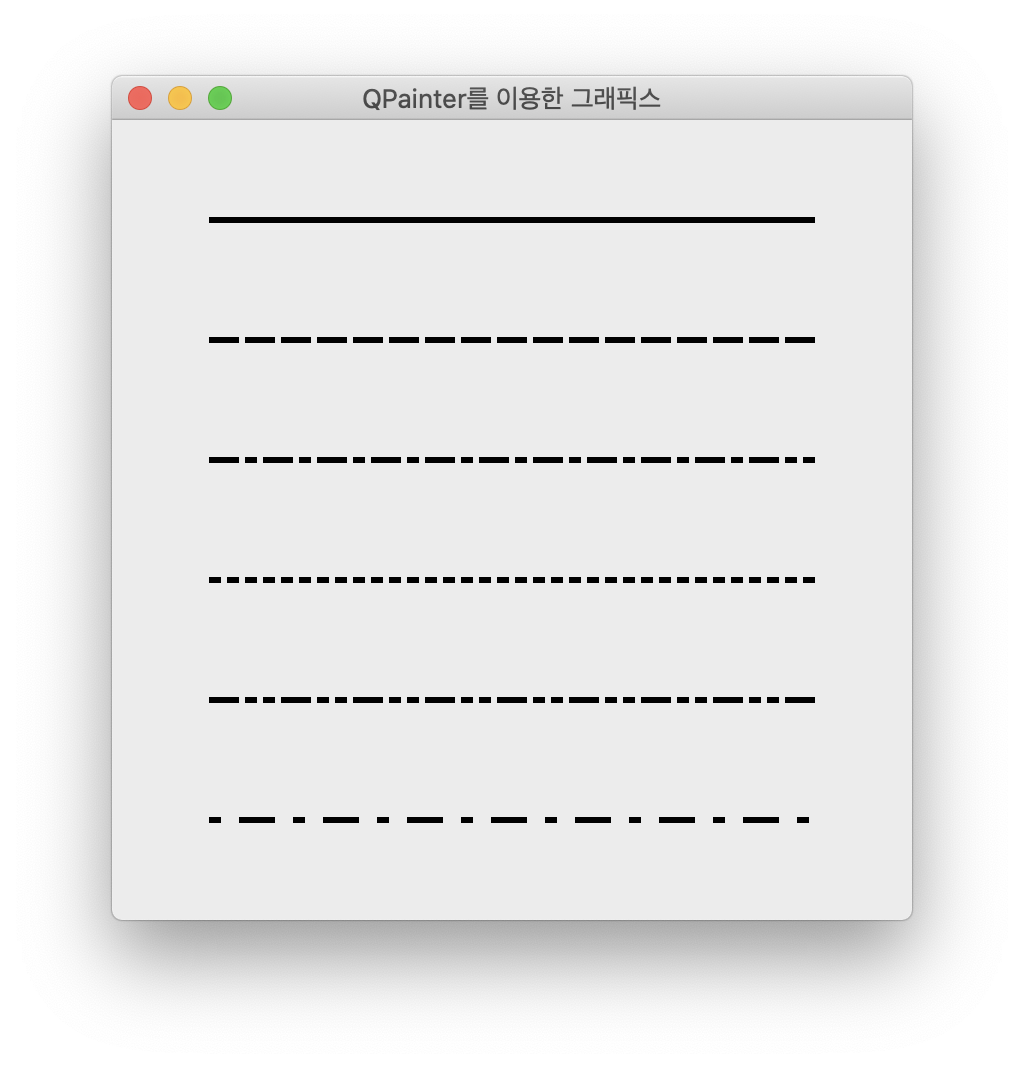
다음은 선을 그리는 함수입니다.

    def drawLines(self, qp):
        pen = QPen(Qt.black, 3, Qt.SolidLine)

        qp.setPen(pen)
        qp.drawLine(50, 50, 350, 50)

        pen.setStyle(Qt.DashLine)
        qp.setPen(pen)
        qp.drawLine(50, 110, 350, 110)

        pen.setStyle(Qt.DashDotLine)
        qp.setPen(pen)
        qp.drawLine(50, 170, 350, 170)

        pen.setStyle(Qt.DotLine)
        qp.setPen(pen)
        qp.drawLine(50, 230, 350, 230)

        pen.setStyle(Qt.DashDotDotLine)
        qp.setPen(pen)
        qp.drawLine(50, 290, 350, 290)

        pen.setStyle(Qt.CustomDashLine)
        pen.setDashPattern([1, 4, 5, 4])
        qp.setPen(pen)
        qp.drawLine(50, 350, 350, 350)

결과는 아래와 같습니다.

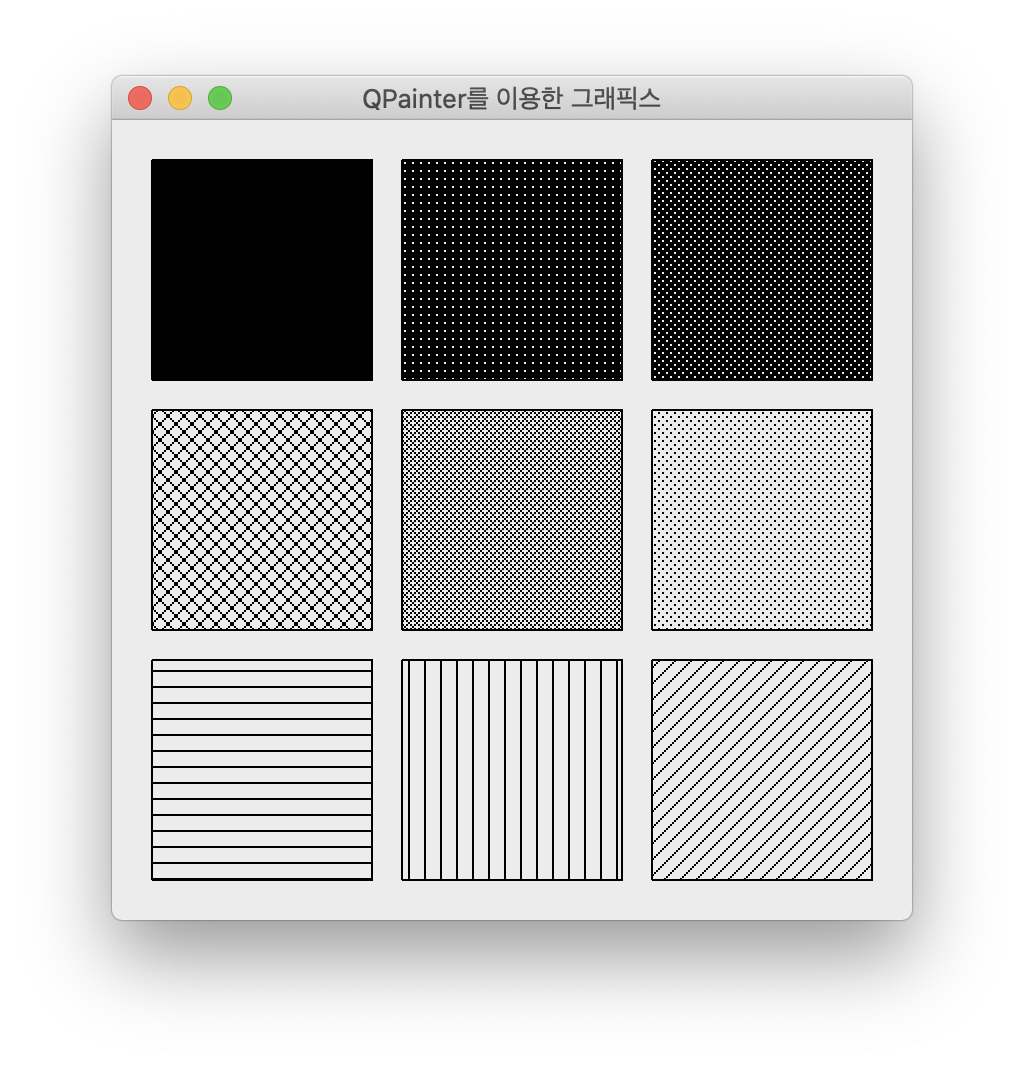
다음은 다양한 채움 스타일로 사각형을 그리는 함수입니다.

    def drawBrushes(self, qp):
        brush = QBrush(Qt.SolidPattern)
        qp.setBrush(brush)
        qp.drawRect(20, 20, 110, 110)

        brush.setStyle(Qt.Dense1Pattern)
        qp.setBrush(brush)
        qp.drawRect(145, 20, 110, 110)

        brush.setStyle(Qt.Dense2Pattern)
        qp.setBrush(brush)
        qp.drawRect(270, 20, 110, 110)

        brush.setStyle(Qt.DiagCrossPattern)
        qp.setBrush(brush)
        qp.drawRect(20, 145, 110, 110)

        brush.setStyle(Qt.Dense5Pattern)
        qp.setBrush(brush)
        qp.drawRect(145, 145, 110, 110)

        brush.setStyle(Qt.Dense6Pattern)
        qp.setBrush(brush)
        qp.drawRect(270, 145, 110, 110)

        brush.setStyle(Qt.HorPattern)
        qp.setBrush(brush)
        qp.drawRect(20, 270, 110, 110)

        brush.setStyle(Qt.VerPattern)
        qp.setBrush(brush)
        qp.drawRect(145, 270, 110, 110)

        brush.setStyle(Qt.BDiagPattern)
        qp.setBrush(brush)
        qp.drawRect(270, 270, 110, 110)

결과는 아래와 같습니다.

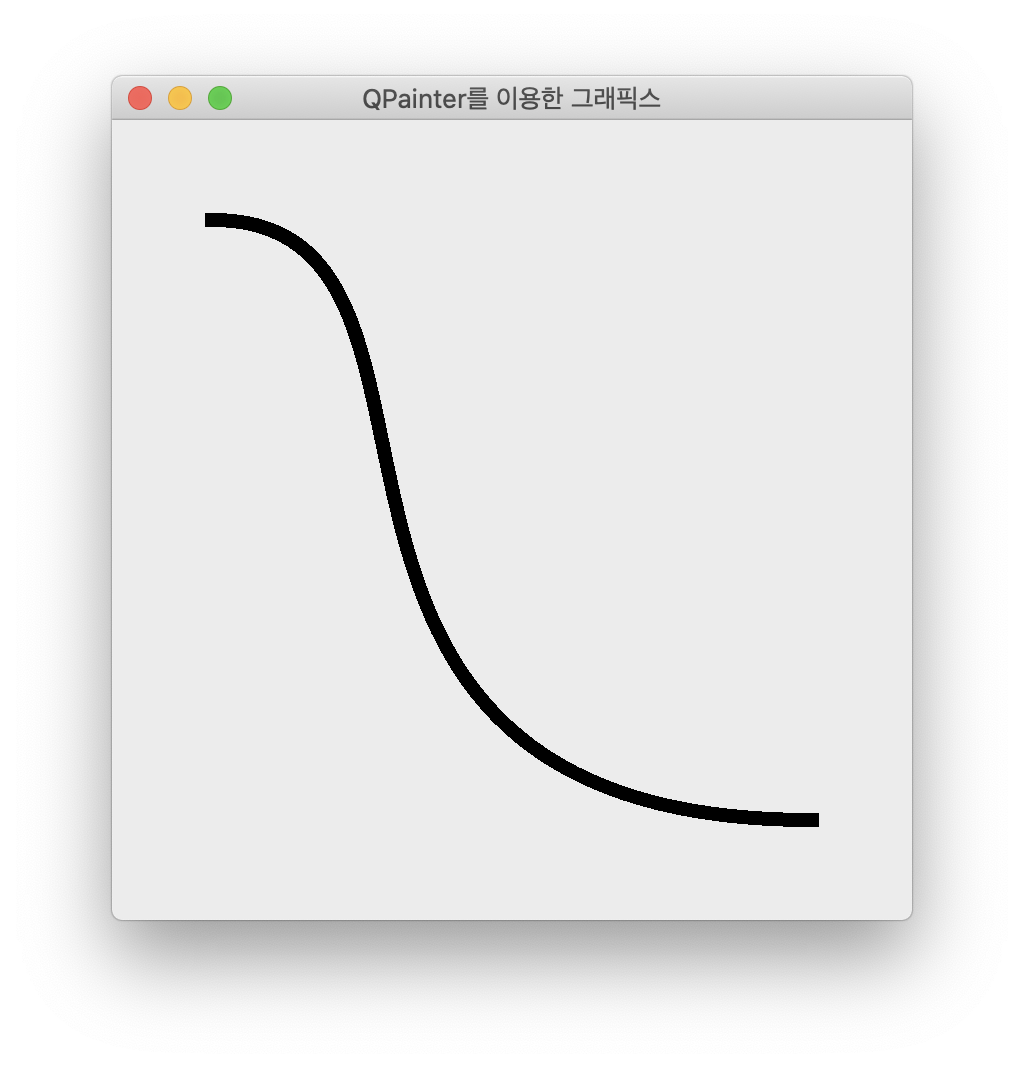
다음은 베이지 곡선을 그리는 함수입니다.

    def drawBezierCurve(self, qp):
        pen = QPen(Qt.black, 7)
        qp.setPen(pen)

        path = QPainterPath()
        path.moveTo(50, 50)
        path.cubicTo(200, 50, 50, 350, 350, 350)
        
        qp.drawPath(path)

결과는 아래와 같습니다.

[PyQt5] 타이머(Timer) 사용하기

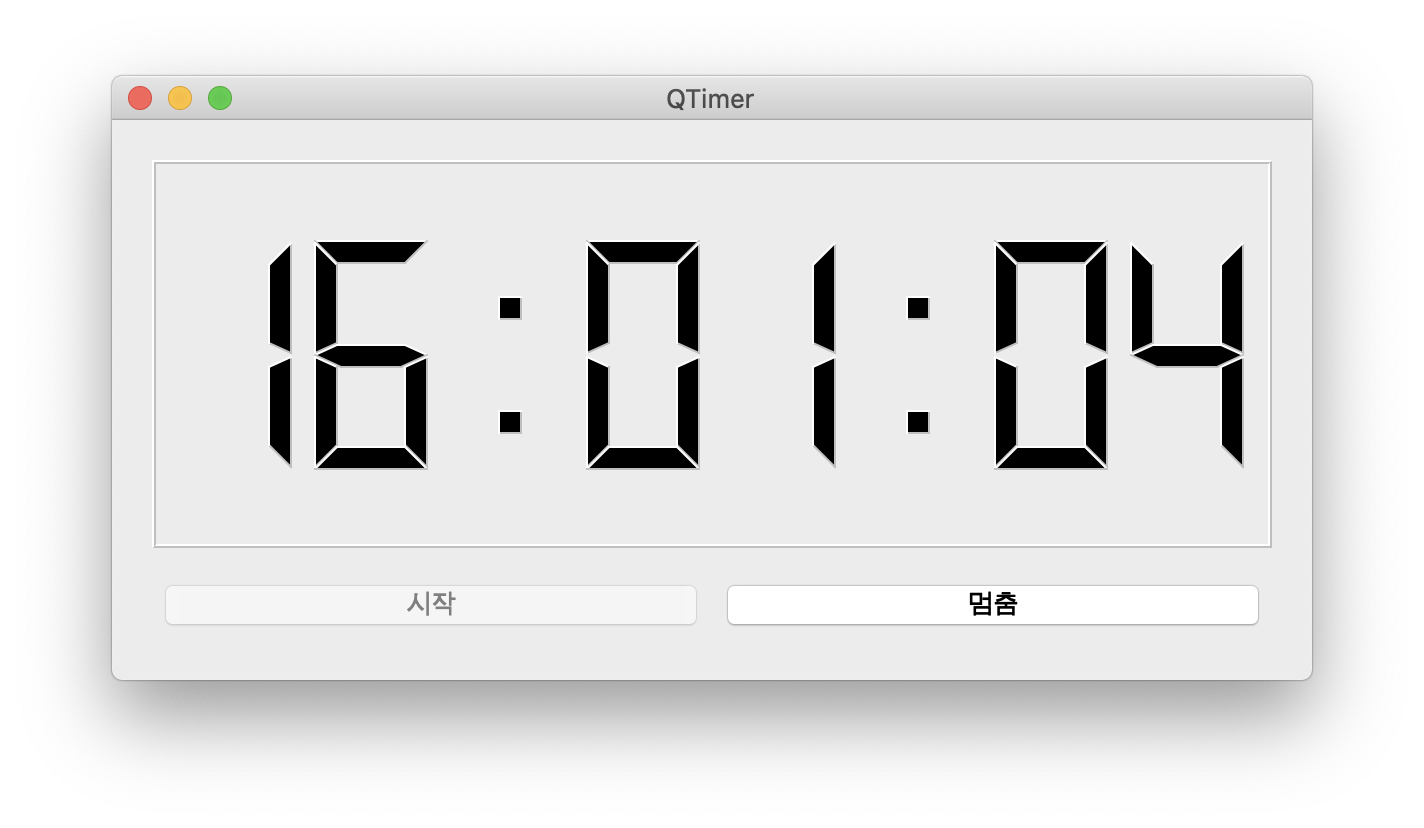
PyQt에서 제공하는 타이머를 사용해 간단한 디지털 시계에 대한 UI를 구성해 보겠습니다. 디지털 시계에 대한 표현은 QLCDNumber라는 위젯을 사용합니다. 아래는 최종 실행 결과입니다.

시작 버튼을 클릭하면, 일정한 주기로 시간 표시가 변경되며 멈춤 버튼을 클릭하면 시간 표시에 대한 갱신을 중단합니다. 멈춤 상태에서 다시 시작 버튼을 클릭하면 시간 표시가 변경되기 시작합니다. 코드는 다음과 같습니다.

import sys
from PyQt5.QtWidgets import *
from PyQt5.QtCore import QTimer, QTime

class MyWindow(QWidget):
    def __init__(self):
        super().__init__()

        self.timer = QTimer(self)
        self.timer.setInterval(1000)
        self.timer.timeout.connect(self.timeout)

        self.setWindowTitle('QTimer')
        self.setGeometry(100, 100, 600, 280)
 
        layout = QVBoxLayout()
 
        self.lcd = QLCDNumber()
        self.lcd.display('')
        self.lcd.setDigitCount(8)

        subLayout = QHBoxLayout()
        
        self.btnStart = QPushButton("시작")
        self.btnStart.clicked.connect(self.onStartButtonClicked)
 
        self.btnStop = QPushButton("멈춤")
        self.btnStop.clicked.connect(self.onStopButtonClicked)
 
        layout.addWidget(self.lcd)
        
        subLayout.addWidget(self.btnStart)
        subLayout.addWidget(self.btnStop)
        layout.addLayout(subLayout)
 
        self.btnStop.setEnabled(False)

        self.setLayout(layout)        

    def onStartButtonClicked(self):
        self.timer.start()
        self.btnStop.setEnabled(True)
        self.btnStart.setEnabled(False)

    def onStopButtonClicked(self):
        self.timer.stop()
        self.btnStop.setEnabled(False)
        self.btnStart.setEnabled(True)

    def timeout(self):
        sender = self.sender()
        currentTime = QTime.currentTime().toString("hh:mm:ss")

        if id(sender) == id(self.timer):
            self.lcd.display(currentTime)

if __name__ == "__main__":
    app = QApplication(sys.argv)
    myWindow = MyWindow()
    myWindow.show()
    sys.exit(app.exec_())

앞서 언급한 타이머의 갱신 시간 주기는 QTimer의 setInterval 함수로 지정하며 단위는 ms로써, 1000이 1초에 해당합니다. 타이머에 대한 갱신 시작과 중지는 각각 start와 stop입니다.

[PyQt5] MatplotLib의 차트를 Widget으로 사용하기

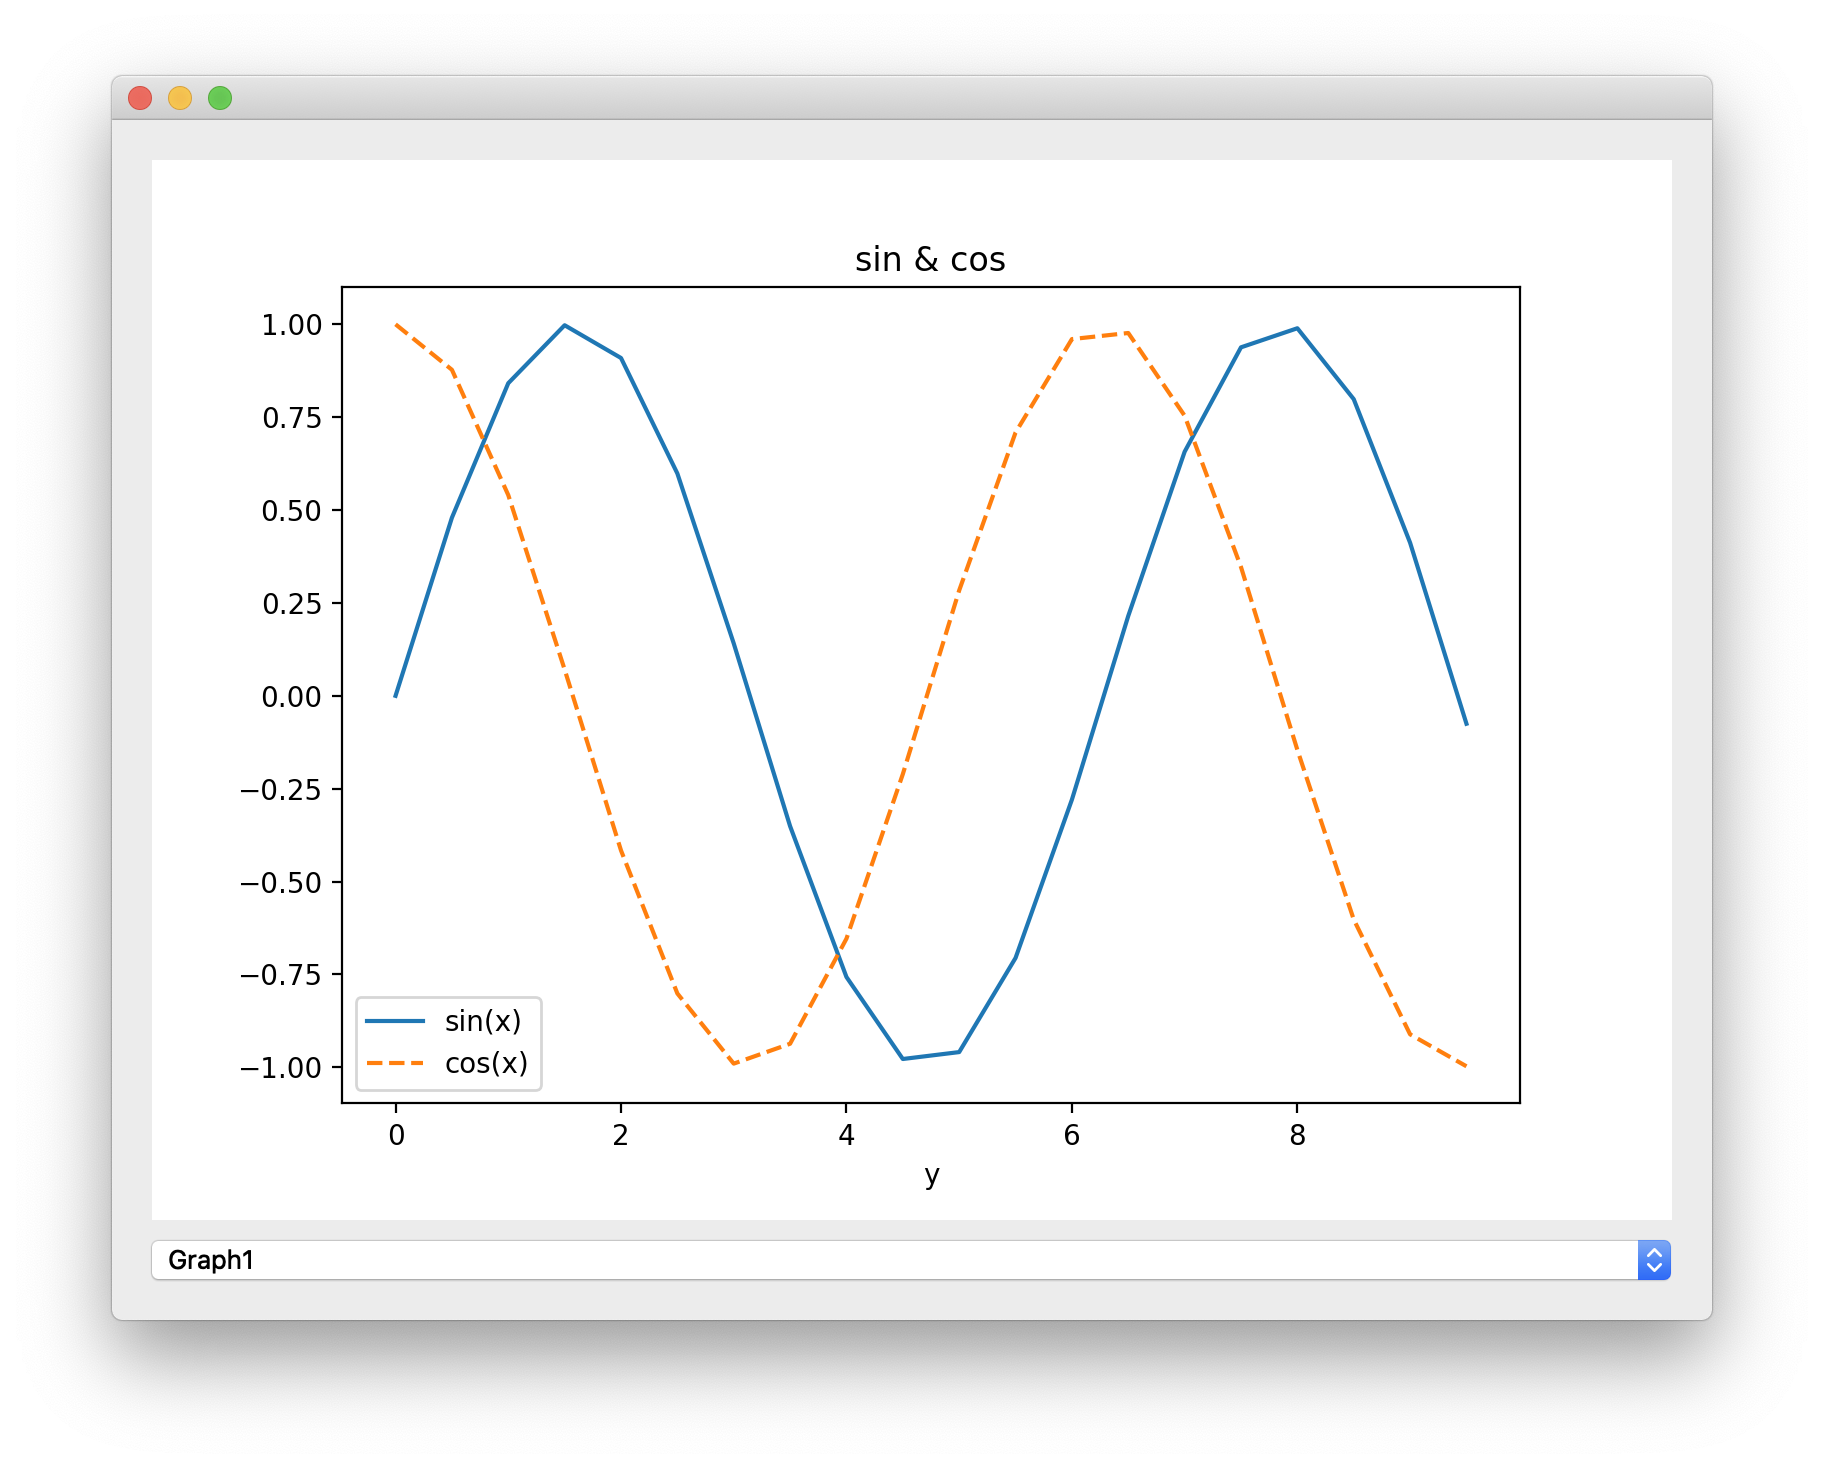
PyQt에서 차트를 위젯으로 사용하기 위해 코드입니다. 먼저 실행 결과는 다음과 같습니다.

하단에 컴보박스를 통해 2가지 항목을 선택할 수 있는데요. 항목을 선택할때마다 해당되는 항목의 그래프가 상단에 표시됩니다.

먼저 이를 위한 UI 구성을 위해 아래와 같은 코드를 작성합니다.

import sys
import numpy as np
from PyQt5.QtWidgets import *
import matplotlib.pyplot as plt
from mpl_toolkits.mplot3d import Axes3D
from matplotlib.backends.backend_qt5agg import FigureCanvasQTAgg as FigureCanvas

class MyWindow(QWidget):
    def __init__(self):
        super().__init__()
        self.initUI()

        self.setLayout(self.layout)
        self.setGeometry(200, 200, 800, 600)

    def initUI(self):
        self.fig = plt.Figure()
        self.canvas = FigureCanvas(self.fig)
        
        layout = QVBoxLayout()
        layout.addWidget(self.canvas)

        cb = QComboBox()
        cb.addItem('Graph1')
        cb.addItem('Graph2')
        cb.activated[str].connect(self.onComboBoxChanged)
        layout.addWidget(cb)

        self.layout = layout

        self.onComboBoxChanged(cb.currentText())

    def onComboBoxChanged(self, text):
        if text == 'Graph1':
            self.doGraph1()
        elif text == 'Graph2':
            self.doGraph2()

    def doGraph1(self):
        ....

    def doGraph2(self):
        ....
            
if __name__ == "__main__":
    app = QApplication(sys.argv)
    window = MyWindow()
    window.show()
    app.exec_()

Qt5에서 Matplot을 사용하기 위해서는 matplotlib.backends.backend_qt5agg 패이지의 FigureCanvasQTAgg라는 이름의 위젯 클래스가 필요하다는 것을 알 수 있습니다. MyWindow 클래스의 doGraph1과 doGraph2 함수의 코드가 핵심인데, 그 내용은 아래와 같습니다.

   def doGraph1(self):
        x = np.arange(0, 10, 0.5)
        y1 = np.sin(x)
        y2 = np.cos(x)
        
        self.fig.clear()

        ax = self.fig.add_subplot(111)
        ax.plot(x, y1, label="sin(x)")
        ax.plot(x, y2, label="cos(x)", linestyle="--")
        
        ax.set_xlabel("x")
        ax.set_xlabel("y")
        
        ax.set_title("sin & cos")
        ax.legend()
        
        self.canvas.draw()

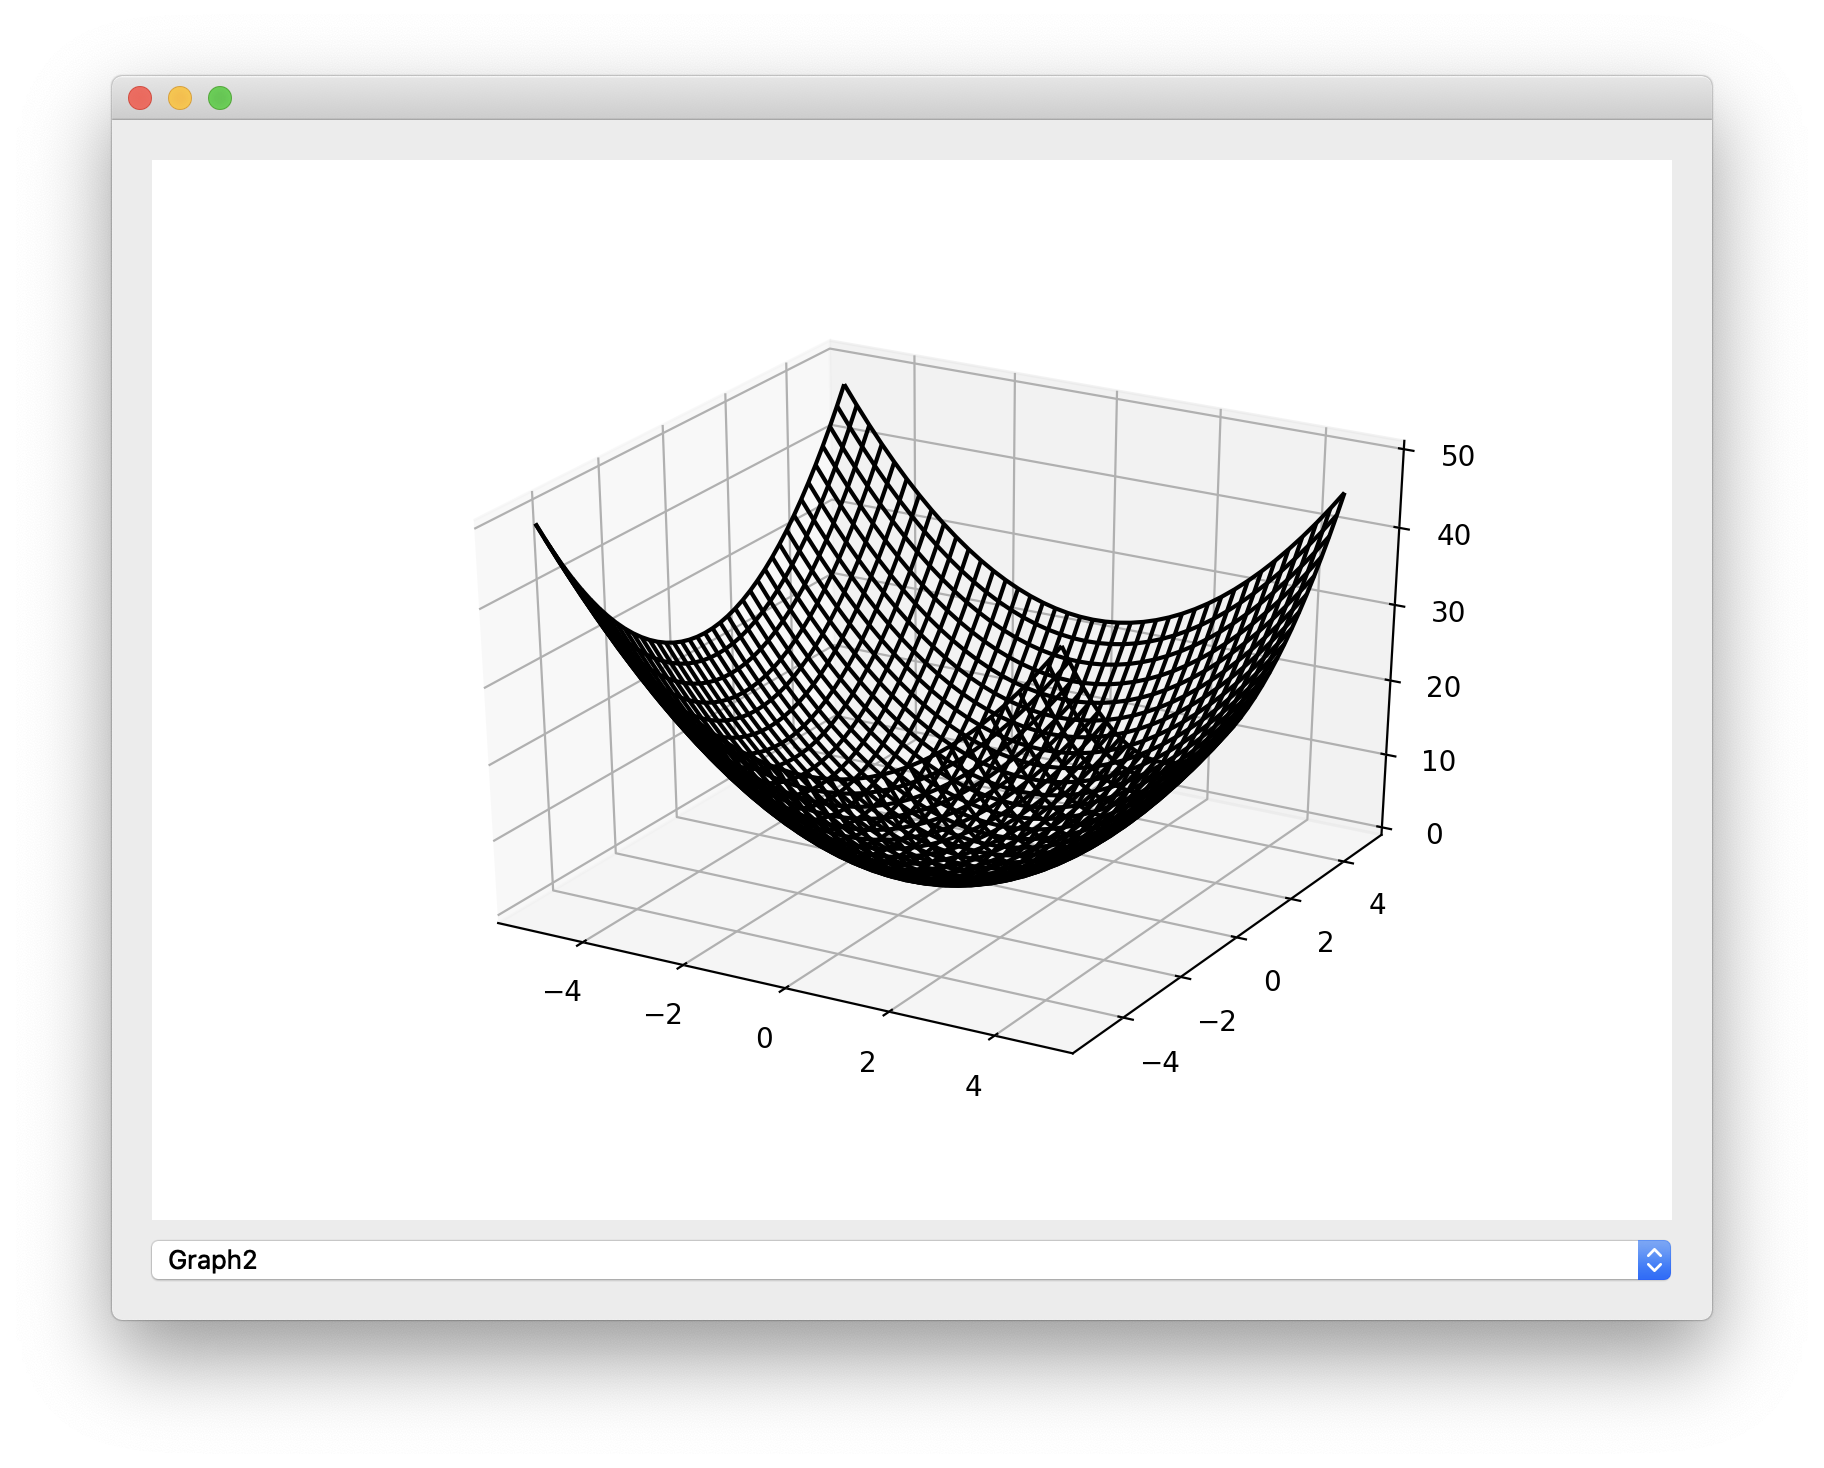
    def doGraph2(self):
        X = np.arange(-5, 5, 0.25)
        Y = np.arange(-5, 5, 0.25)
        X, Y = np.meshgrid(X, Y)
        Z = X**2 + Y**2
        
        self.fig.clear()
        
        ax = self.fig.gca(projection='3d')
        ax.plot_wireframe(X, Y, Z, color='black')

        self.canvas.draw() 

doGraph2 함수에 대한 실행 결과는 다음과 같습니다. 물론 이 함수의 실행은 컴보박스의 항목 중 Graph2를 선택했을때 실행됩니다.

참고로 이 글의 차트는 아래의 글을 참고로 하여 작성하였습니다.

파이썬의 matplotlib 노트