gwc-card + gwc-vscrollview 에서 resizing

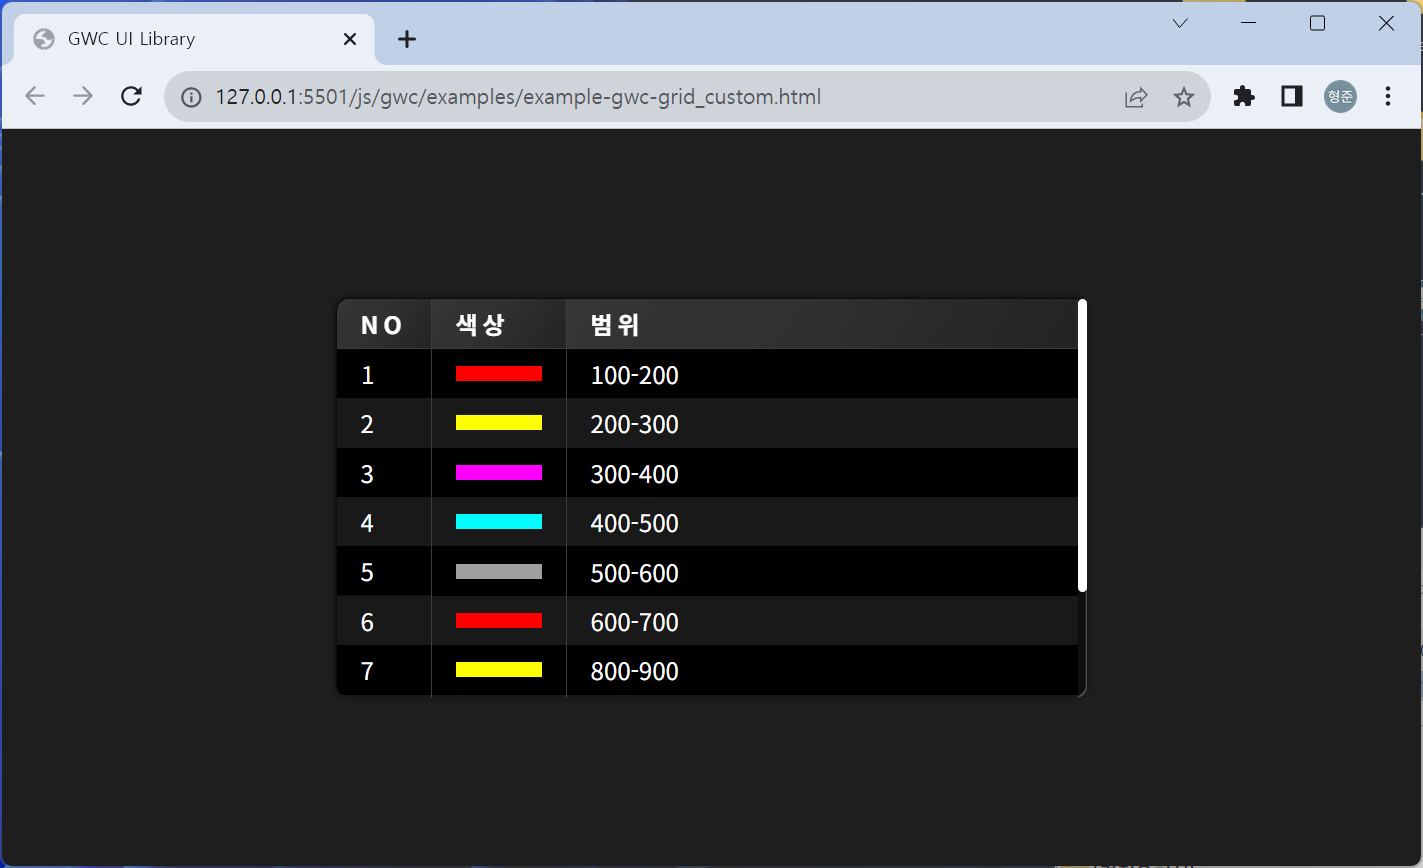
gwc-card 내부에 gwc-vscrollview를 배치하고 자연스러운 resizing을 위한 코드인데 추후 범용적인 개선이 필요하기에 메모를 남김.

먼저 DOM 구성을 위한 코드는 다음과 같다.

const domLayout = document.createElement("div");
domLayout.classList.add("layer-editor-attributes", "gwc-show-animation");

const htmlContent = .... ;

const html = /* html */`


${htmlContent}
`; domLayout.innerHTML = html; const domCard = domLayout.querySelector("gwc-card"); domCard.resizablePanel.resizableLeft = false; domCard.resizablePanel.resizableRight = true; domCard.resizablePanel.resizableTop = false; domCard.resizablePanel.resizableBottom = true; domCard.resizablePanel.minWidth = 200; domCard.resizablePanel.minHeight = 68;

스타일은 다음과 같다.

.layer-editor-attributes {
    width: 0;
    height: 0;
}

.layer-editor-attributes gwc-card {
    top: 120px;
    left: 20px;
    width: 270px;
    height: 180px;
}

.layer-editor-attributes gwc-card gwc-vscrollview {
    margin: 0.3em 0;
    width: 100%;
    height: 100%;
}

.layer-editor-attributes .content {
    height: 0;
}

.layer-editor-attributes .content .vertical-linear-layout {
    gap: 0.2em;
}

.layer-editor-attributes .content > div > div > gwc-label {
    width: 7.5em;
    zoom: 0.8;
}

.layer-editor-attributes .content gwc-textinput {
    flex: 1;
    zoom: 0.8;
}

.layer-editor-attributes gwc-resizable-panel {
    height: 100%;
}

위 스타일 코드 중 15번째에서 height를 0으로 주고 있다는 것이 핵심이다. 추후 이 부분에 대해서 그 이유를 파악하고 응용쪽이 아닌 컴포넌트 쪽에 반영할 필요가 있다.

#GWC UI Library : Grid (Custom Draw)

웹 UI 라이브러리인 GWC에서 제공하는 Grid 컴포넌트에서 셀 내용을 사용자정의 형태로 표현하는 예제 코드입니다.

먼저 DOM 구성은 다음과 같습니다.

그리고 CSS 구성은 다음과 같구요.

.center {
    display: flex;
    width: 100%;
    height: 100%;
    justify-content: center;
    align-items: center;
    gap: 1em;
}

#grid {
    width: 500px;
    height: 250px;
}

js 코드는 다음과 같습니다.

window.onload = () => {
    grid.columns = [
        { name: "NO", width: "20px" },
        { name: "색상" },
        { name: "범위" },
    ];

    const columnIndex = 1
    grid.setCustomDrawMethod(columnIndex, (item, parentDom) => {
        const dom = document.createElement("div")
        dom.style.width = "100%"
        dom.style.height = "10px"
        dom.style.backgroundColor = item

        parentDom.style.width = "90px"

        return dom
    })

    grid.data = [
        { values: ["1", "#ff0000", "100-200"] },
        { values: ["2", "#ffff00", "200-300"] },
        { values: ["3", "#ff00ff", "300-400"] },
        { values: ["4", "#00ffff", "400-500"] },
        { values: ["5", "#9f9f9f", "500-600"] },
        { values: ["6", "#ff0000", "600-700"] },
        { values: ["7", "#ffff00", "800-900"] },
        { values: ["8", "#ff00ff", "1000-1100"] },
        { values: ["9", "#00ffff", "1100-1200"] },
        { values: ["10", "#9f9f9f", "1300-1400"] },
    ];

    // grid의 data를 먼저 지정하고 setCustomDrawMethod를 그 다음에 호출할 경우 아래의 코드가 필요함
    //grid.update() 

    grid.fixFirstColumn = true;

    grid.addEventListener("columnclick", (event) => {
        const v = grid.getColumn(event.detail.index).name;
        gwcMessage(`컬럼명: ${v}`);
    });

    grid.addEventListener("dataclick", (event) => {
        const v = grid.getData(event.detail.row, event.detail.column);
        gwcMessage(`데이터: ${v}`);
    });
};

실행 결과는 다음과 같습니다.